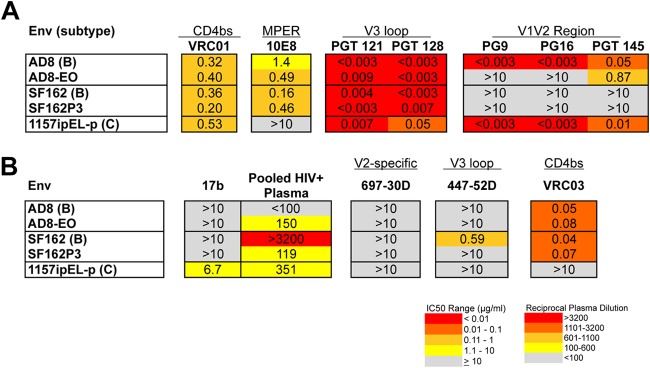
FIG 4.

Summary of neutralization profiles of Env proteins from pathogenic SHIVs. The pathogenic SHIVs from which the Env proteins were derived are indicated in the first column along with the subtypes (in parentheses) (A, B). Darker shading indicates increasing sensitivity to the MAb tested or increasing sensitivity to HIV+ pooled plasma, according to the key at the bottom. Gray shading indicates that 50% neutralization was not reach at the highest concentration tested (10 μg/ml) for MAbs or the highest dilution of plasma tested (1:100).
