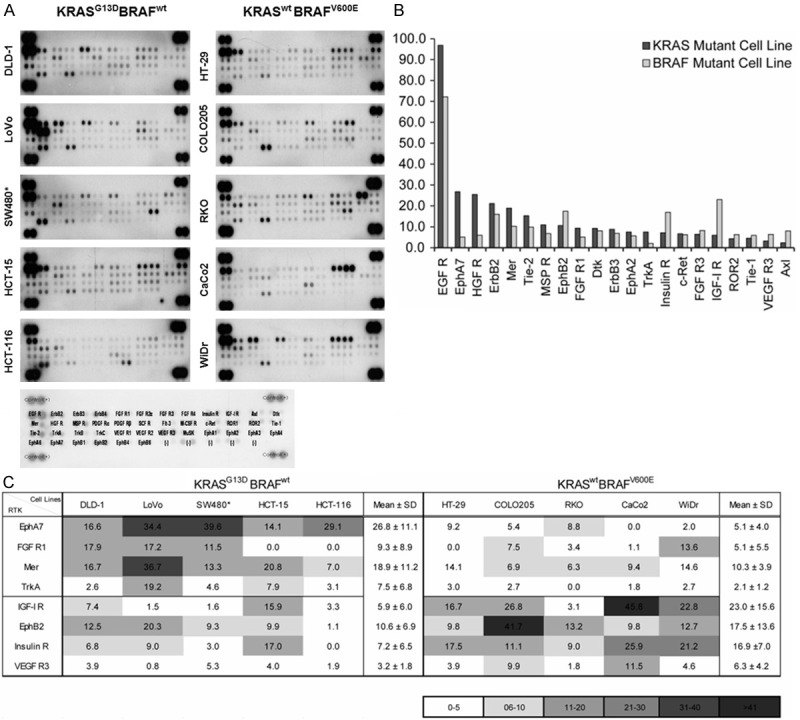
Figure 1.

Differently activated RTKs in 10 CRC cell lines carrying KRAS or BRAF mutation. A. Human phospho-RTK array was done among 10 CRC cell lines. Each RTK is spotted in duplicate and positive controls are the pairs of dots in each corner. The activated RTK levels were quantitated using GenePix Pro 4.1 software (Axon Instruments) and relative RTK intensity was calculated comparing with positive control’s intensity in each membrane. B. Among the RTKs tested, the mean values of relative RTK intensity that are the same or > 5.0 are shown on the graph. RTKs appeared to be more highly activated in KRAS mutant cell lines than in BRAF mutant cell lines. C. The 8 RTKs that were differently activated because of KRAS or BRAF mutation in the CRC cell lines are shown in the table and the heat-map. *SW480 carries the KRAS G12V mutation, whereas the other 4 cell lines carry the KRAS G13D mutation.
