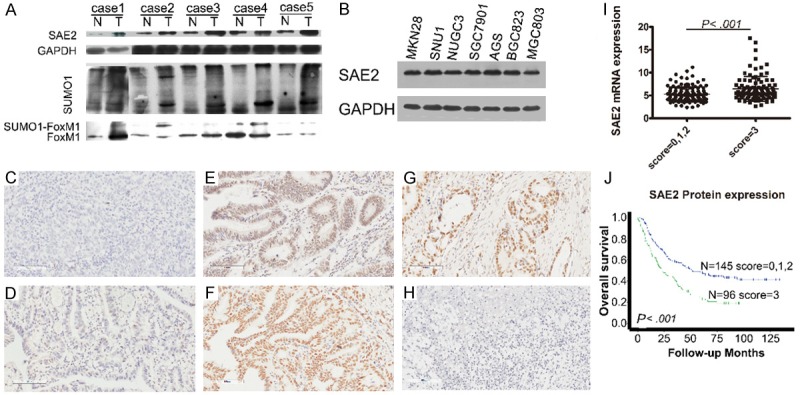
Figure 1.

SAE2 expression in GC. (A) Adjacent noncancerous tissues (N) and primary GC tissues (T) were examined by western blotting. (B) Western blotting analysis of SAE2 expression in GC cell lines. (C and D) Negative staining of SAE2 in GC. Cases of no nuclear staining (IHC 0; C), weak staining of the cytoplasm (IHC 1+; D). (E) Moderate staining of the nuclei (IHC 2+). (F) Strong staining of the nuclei (IHC 3+). (G) SAE2 expression at the invasive front in lesions deeper than muscularis propria. (H) Negative control. (I) Quantigene Plex analysis of SAE2 mRNA in 230 GC specimens. (J) Dichotomization of SAE2, Kaplan-Meier survival analysis of OS for radical cure patients.
