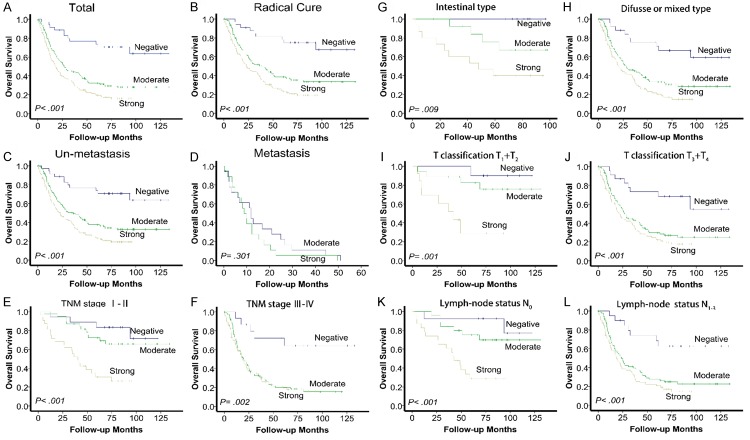
Figure 2.
SAE2 expression and survival in patients with GC. Kaplan-Meier survival analysis of overall survival for all patients (A) and radical cure patients (B). Statistical significance of the difference between the curves of SAE2 negative, moderate and strong patients was compared in patient subgroups: M0 (C) and M1 (D) patient subgroups, TNM stage I to II (E) and TNM stage III to IV (F) patient subgroups, Lauren classification intestinal type (G) and diffuse or mixed type (H) patient subgroups, T classification T1 + T2 (I) and T3 + T4 (J) patient subgroups, and lymph node status N0 (K) and lymph node status N1-3 (L) patient subgroups.

