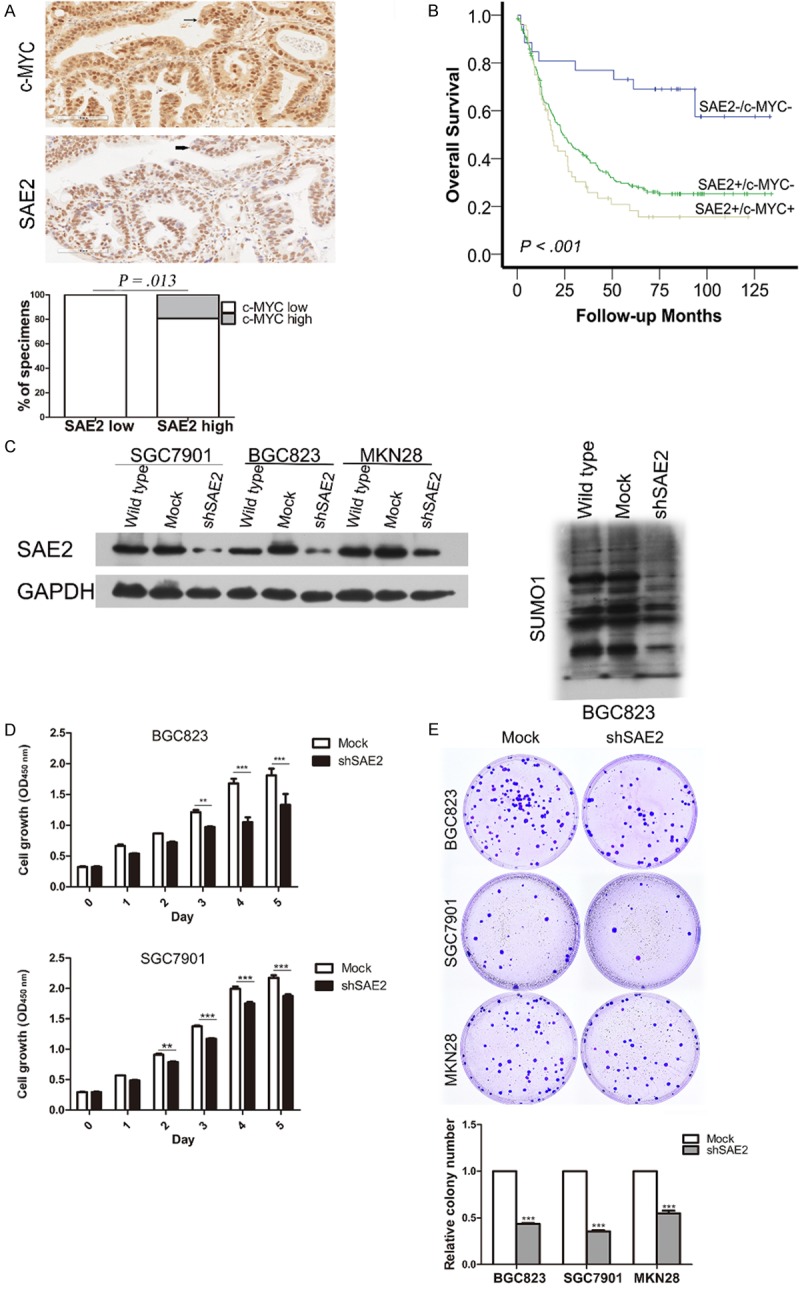
Figure 3.

Effects of SAE2 depletion on cell growth in vitro. C-MYC expression levels significantly correlated with SAE2 expression in human GC tissues. One representative case is shown, c-MYC and SAE2 nuclear expression are indicated by arrow, and the percentage of specimens with low or high SAE2 expression, relative to the levels of c-MYC staining (A), Kaplan-Meier survival analysis of overall survival for 276 patients with GC according to the combined expression of SAE2 and c-MYC (B) including SAE2-/MYC-, SAE2+/MYC-, and SAE2+/MYC+. Western blotting analysis of SAE2 expression in SAE2-silenced BGC823, SGC7901 and MKN28 cells and SUMO1 in SAE2-silenced BGC823 cells (C), CCK-8 assay (D) and colony formation assay (E) indicated that the growth rate decreased in the SAE2-silenced cells. The number of colonies was quantified in the colony formation assay. The data shown are the mean ± SD. *p < 0.05, **p < 0.01, ***p < 0.001.
