
Figure 5.
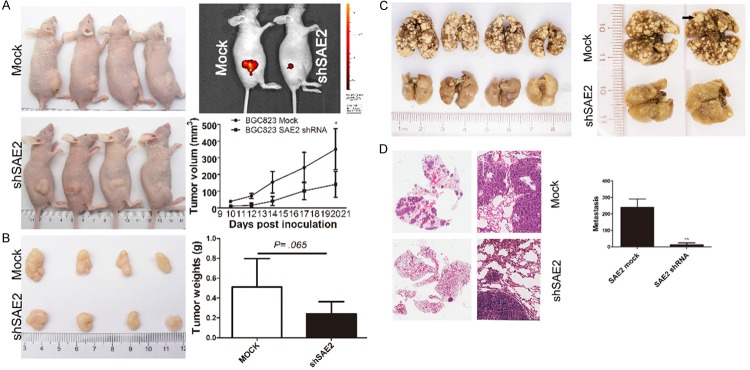
SAE2 depletion inhibits subcutaneous GC xenograft growth and metastasis in vivo. A. Tumor size at different days was measured using a vernier caliper and was expressed as volume (mm3) according to the following formula: tumor volume = (length × width2)/2. B. Twenty days later, the mice were sacrificed and the tumors were collected and weighed. The data are shown as the means ± SD (*p < 0.05, **p < 0.01, ***p < 0.001). C. Representative tumor nodules in the lungs are shown. Arrows indicate the tumor nodules. D. The graph shows representative HE-stained sections of lung metastasis.