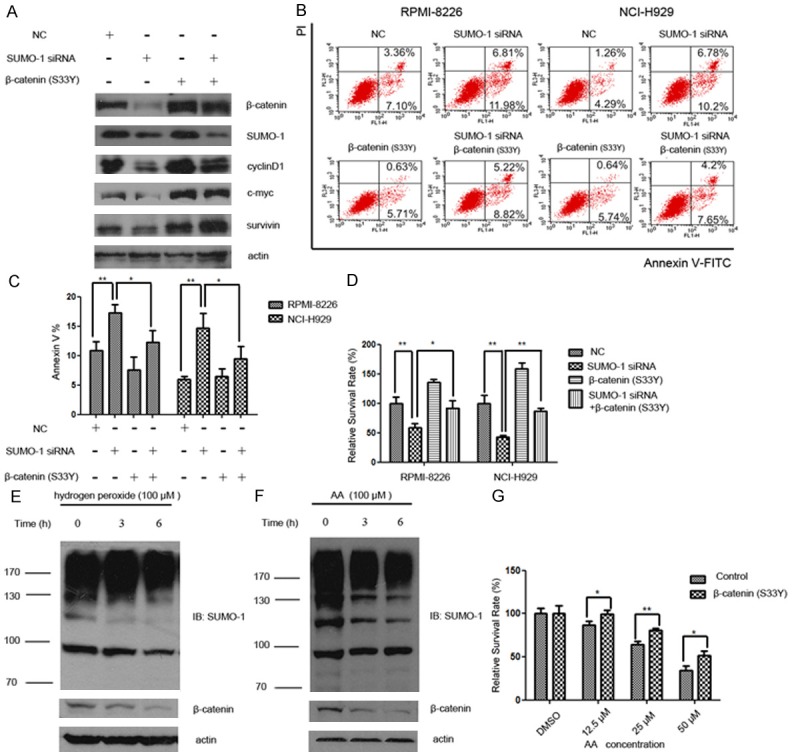
Figure 3.

Overexpression of β-catenin rescued Wnt/β-catenin pathway activity and partially prevented increased apoptosis and growth inhibition induced by SUMOylation inhibition. A. Myeloma cells NCI-H929 were treated with SUMO-1 siRNA and/or β-catenin (S33Y) plasmid for 48 hours. Protein samples were subjected to western blot analysis for the Wnt/β-catenin downstream effector proteins (c-myc, cyclinD1, survivin) with indicated antibodies. B. The distribution of apoptotic cells following treatment of myeloma cells with SUMO-1 siRNA, β-catenin (S33Y) expression vector, or both were evaluated using annexin V and propidium iodide (PI) double staining. Early apoptotic cells (Annexin-V+ and PI-) were displayed in the lower right quadrant and late apoptotic cells (Annexin-V+ and PI+) were shown in the upper right quadrant. C. The percentage of all the apoptotic cells (including Annexin-V+ PI- and Annexin-V+ PI+ cells) were indicated by Annexin-V+ cells shown as mean ± SD from three independent experiments. D. The growth inhibition of myeloma cells following different treatments was shown by the percentage of relative survival rate (OD value of sample/OD value of control in each group×100%) (*p < 0.05, **p < 0.01 by Student’s t-test). These experiments were performed three times. E. Myeloma cells (NCI-H929) were exposed to hydrogen peroxide (100 μM) for indicated time intervals (0, 3 h, 6 h). Cell lysate was subjected to western blot with anti-β-catenin and anti-SUMO-1 antibody, respectively. F. Myeloma cells (NCI-H929) were exposed to anacardic acid (AA) (100 μM) for indicated time intervals (0, 3 h, 6 h). Cell lysate was subjected to western blot with anti-β-catenin and anti-SUMO-1 antibody, respectively. G. 48 hours after transfection of β-catenin plasmid, cells were exposed to different concentrations of anacardic acid (AA) (12.5 μM, 25 μM, 50 μM). 48 hours later, cell viability was evaluated using MTS assay as described under “Materials and methods”. These experiments were performed three times. Relative survival rate was calculated as “OD value of sample / OD value of DMSO sample in each transfection group×100%”. MTS assays were performed in in triplicate and repeated at least twice (*p < 0.05, **p < 0.01 by Student’s t-test).
