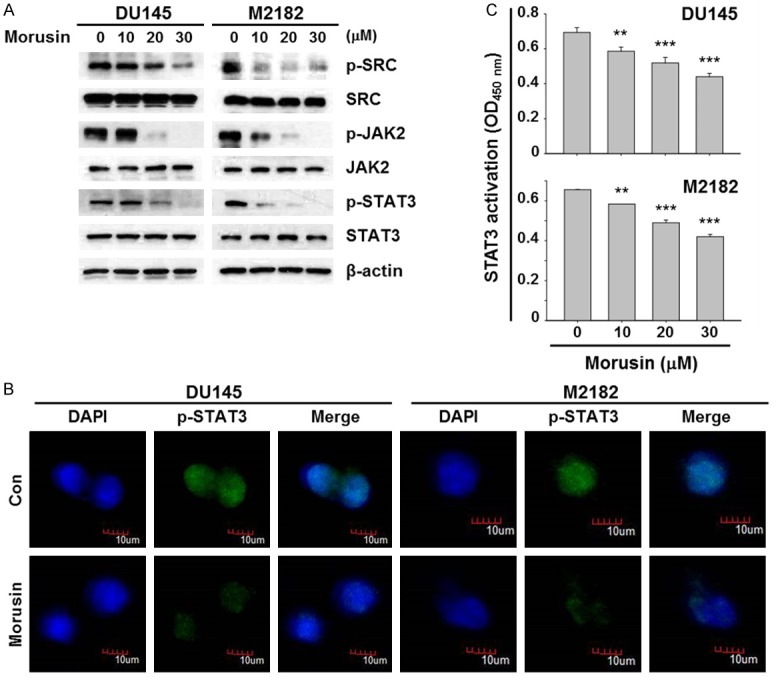
Figure 3.

Effect of morusin on the STAT3 signaling pathway in human prostate cancer cells. A. DU145 and M2182 cells were treated with morusin for 6 hours. Cell lysates were subjected to Western blotting with the indicated antibodies. β-actin was used as an internal control. B. DU145 and M2182 cells were treated with morusin (30 μM) for 6 hours. The p-STAT3 and DAPI staining were analyzed by confocal microscopy. Scale bar, 10 μm. C. DU145 and M2182 cells were treated with morusin for 24 hours. Nuclear extracts were subjected for measuring the STAT3 DNA binding activity. Data in the graphs are presented as the mean ± SEM (**, P < 0.01; and ***, P < 0.001 versus mock-treated control).
