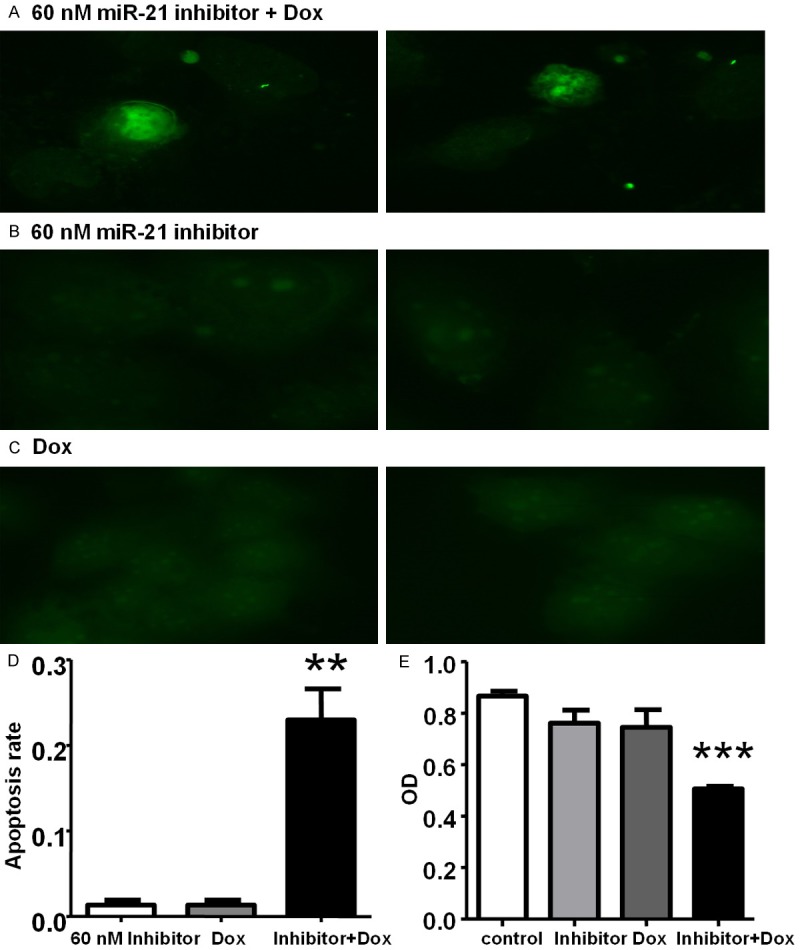
Figure 5.

TUNEL assay, showing apoptotic nuclei in green. A: miR-21 inhibitor plus Dox. B: miR-21 inhibitor alone. C: Dox alone. D: Increased apoptotic rate after concomitant treatment with miR-21 inhibitor 60 nM and Dox 0.5 µg/ml (**p < 0.01). Bar chart shows the percentage (mean ± SD) of apoptotic cells counted from three randomly selected view fields. E: Cytotoxicity response of T98G cells transfected with miR-21 inhibitor 60 nM (96 h) and treated with Dox 0.5 ug/ml (72 h). Data are presented as mean ± SD (error bar). ***p < 0.001 inhibitor plus Dox vs control.
