
Figure 1.
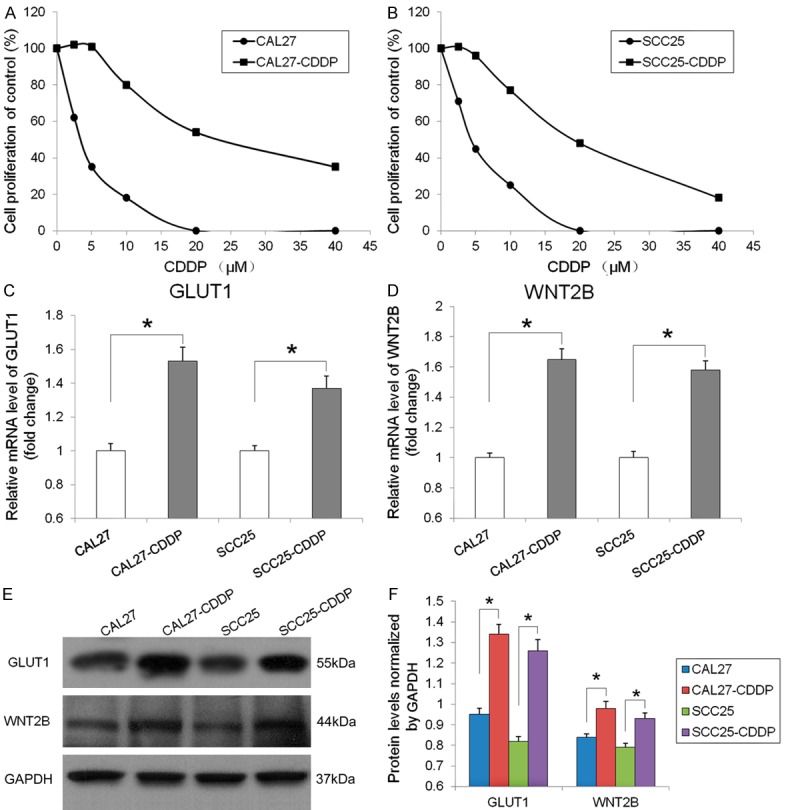
GLUT1 and WNT2B expression in cisplatin resistant HNSCC cells. (A and B) Cell viability was assessed using the MTT assay in CAL27 and SCC25 cells and their cisplatin resistant counterparts (CAL27-CDDP and SCC25-CDDP) after culture for 72 h with different concentrations of cisplatin (CDDP). (C) GLUT1 and (D) WNT2B mRNA levels detected by qRT-PCR and normalized to the levels of β-actin are expressed as fold-change relative to the parental cell lines. *P < 0.05. (E) GLUT1 and WNT2B protein expression detected by western blotting with GAPDH as the loading control. (F) Quantification of GLUT1 and WNT2B protein levels normalized to GAPDH, *P < 0.05.