
Figure 4.
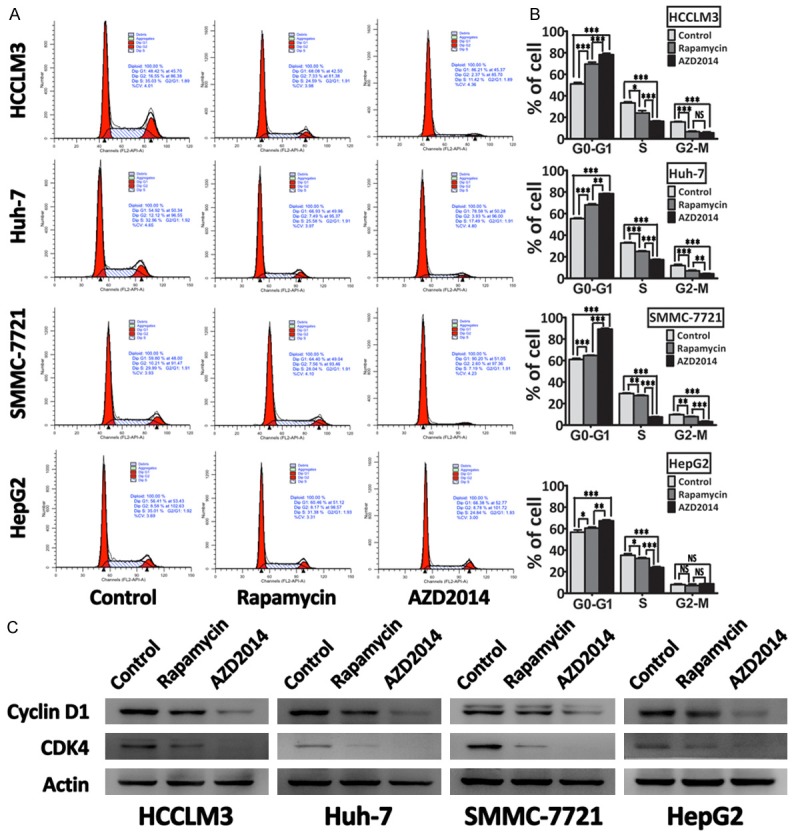
AZD2014 decreases cell cycle progression in HCC cells. A: HCCLM3, Huh-7, SMMC-7721, and HepG2 cells were treated with AZD2014 or rapamycin at concentrations of 100, 440, 140 and 600 nM, respectively, for 48 hours. Then, cell cycle profile was determined on a flow cytometer. Cells in the control group were treated with DMSO. B: Quantification of the percentage of cells in each cell cycle phase. Columns, mean of three independent experiments; bars, SD. *P < 0.05, **P < 0.01, ***P < 0.001, NS = not significant. C: Immunoblot analysis for Cyclin D1 and CDK4 in HCC cells treated as described above.