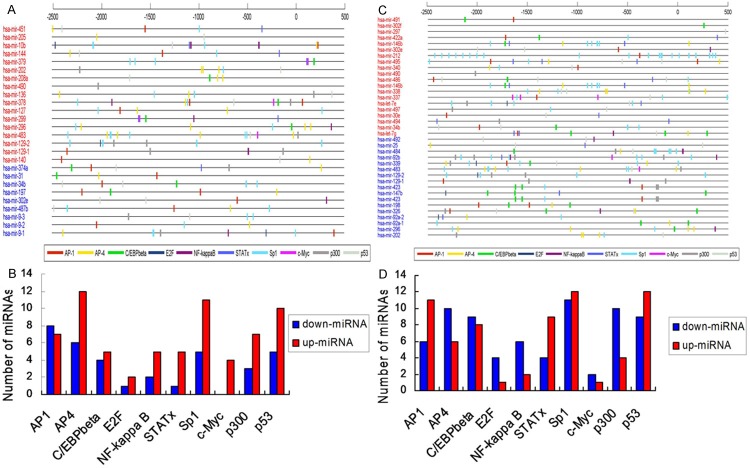
Figure 7.
Analysis of transcription factor loci (A, C) and distribution of related transcription factors (B, D) in groups A and B. In Figure 8B and 8D, longitudinal axis is the number of miRNAs regulated by transcription factors, horizontal axis is the name of the corresponding transcription factors.

