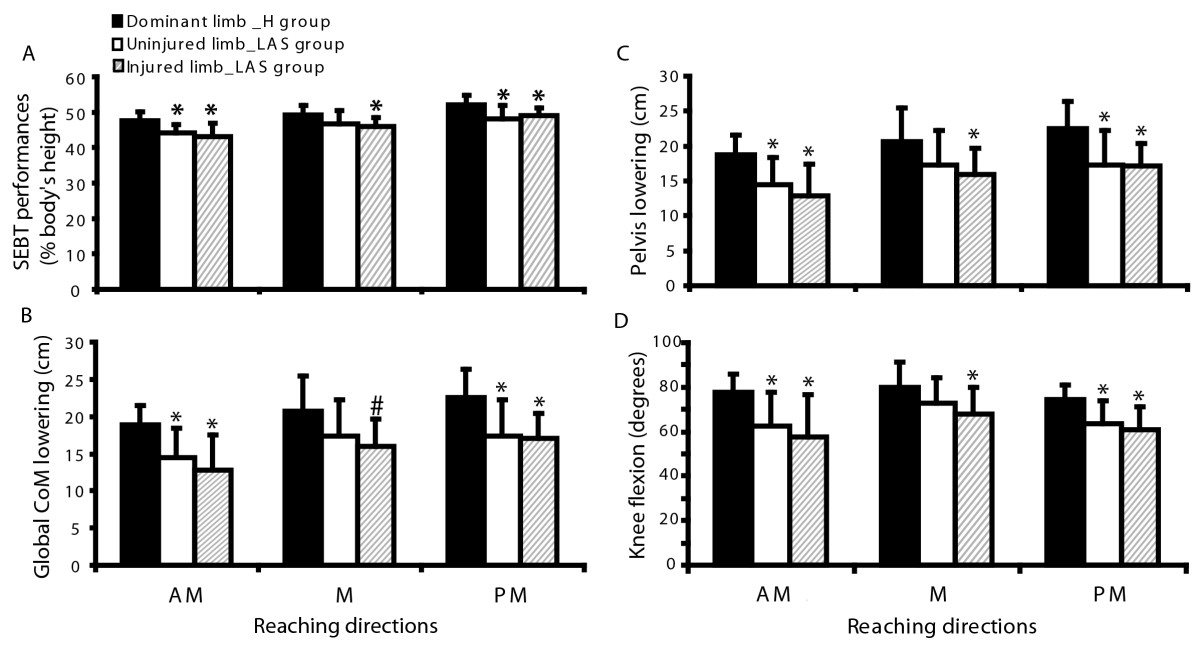
Figure 4.

Comparison of SEBT performance and motor strategies variables associated with CoMgl lowering between limbs (injured and uninjured) of the LAS group and the dominant limb of the healthy group for each direction. Bar graphs represent the mean (n = 10 limbs per direction) and 1 standard deviation. Significant differences between groups are identified by asterisk (MANOVA test; *p <0.05; # p = 0.052). A: SEBT performance (maximal reach distance) expressed in percentage of the body height. B: Global motor strategy: Global CoM lowering, C: Segmental motor strategy: Pelvis lowering and D: Segmental motor strategy: Maximal knee flexion.
