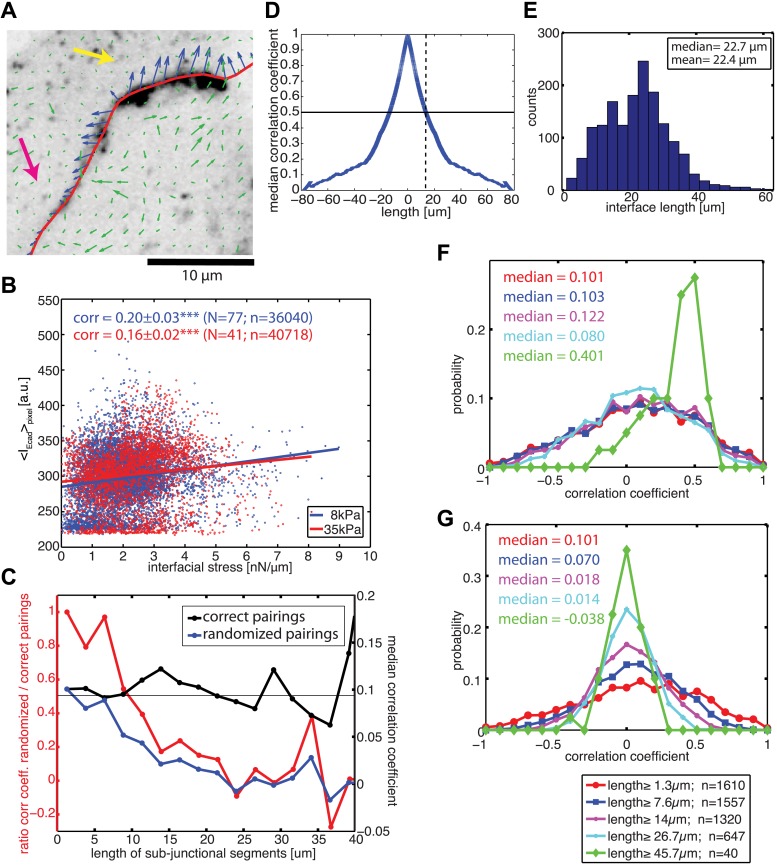
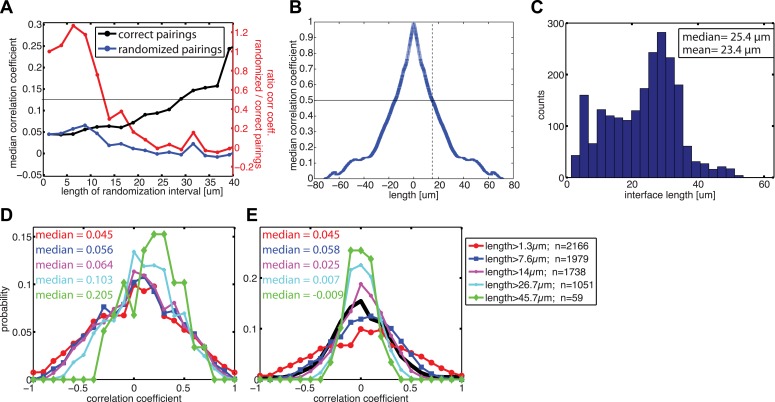
Figure 6. Correlation between calculated cell–cell forces at sub-junctional resolution and local E-cadherin-GFP intensities.
(A) E-cadherin-GFP intensity along a cell–cell junction overlaid by cell–cell stresses (blue) calculated by FEM (magnified region of interest indicated in Figure 3A). Green vectors: traction forces; yellow and magenta arrows highlight sub-junctional segments where high and low E-cadherin-GFP intensity correlated with high and low forces, respectively. (B) Correlation between local E-cadherin-GFP intensities and local calculated cell–cell forces for cell clusters cultured on 8 kPa and 35 kPa substrates. Correlation coefficients were calculated from n measurements from N distinct cell–cell junctions pooled from 5 independent experiments. For visualization purposes, the plot displays only a subset of the measurements extracted from one experiment. (C) Median correlation coefficients for correlation between local E-cadherin-GFP intensities and cell–cell forces calculated from sub-junctional segments of various lengths (correct pairings). Local E-cadherin-GFP intensities were then randomized within the sub-junctional segments of various lengths and correlated with calculated cell–cell forces from the corresponding segments (randomized pairings). The length-scale over which cell–cell stresses and E-cadherin intensity are coupled is estimated as the minimal sub-junctional segment length for which the ratio between the median correlation coefficient of randomized pairings and the median correlation coefficient of correct pairings drops below 0.5 (gray horizontal line), that is, randomization in shorter sub-junctional segments has no effect. Results were calculated from 77 junctions of 14 cell clusters cultured on 8 kPa substrates. (D) Autocorrelation of E-cadherin-GFP intensities along the same 77 junctions. Dotted line shows the sub-junctional length where the median autocorrelation coefficient drops below 0.5 (horizontal line). (E) Distribution of cell–cell junction lengths of 77 junctions, each measured over multiple time points. (F) Distribution of correlation coefficients between local E-cadherin-GFP intensities and cell–cell forces calculated from junctions of different lengths. (G) Distribution of correlation coefficients between local E-cadherin-GFP intensities and cell–cell forces randomized within junctions of different lengths. n = total number of measurements from 77 junctions of 14 cell clusters cultured on 8 kPa substrates. Similar results were found for cell clusters cultured on 35 kPa substrates (Figure 6—figure supplement 1).


