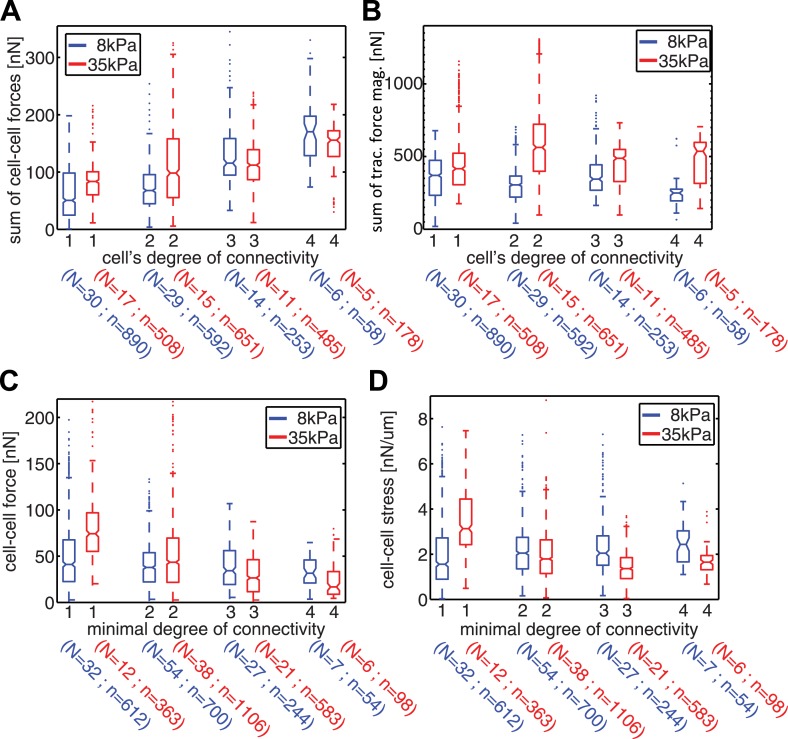
Figure 7. Spatial organization of cell–cell forces in clusters.
(A–B) The sum of cell–cell force magnitudes (A) and traction force magnitudes (B) for cells connected to 1, 2, 3, or 4 neighbors (degree of connectivity k). (C) Force magnitudes at individual cell–cell junctions, classified according to the minimal degree of connectivity (smaller of the k values for the two connected cells). (D) Stress at individual cell–cell junctions, classified according to the minimal degree of connectivity. Center line within box represents median, notches indicate the 95% confidence interval about median. Non-overlapping notches between samples indicate that the sample medians differ with statistical significance at the 5% level. Lower and upper bounds of box indicate first and third quartiles. Whiskers indicate 1.5 times inter-quartile range. Points outside the whiskers represent outliers. n = total number of measurements from N distinct cells or junctions.

