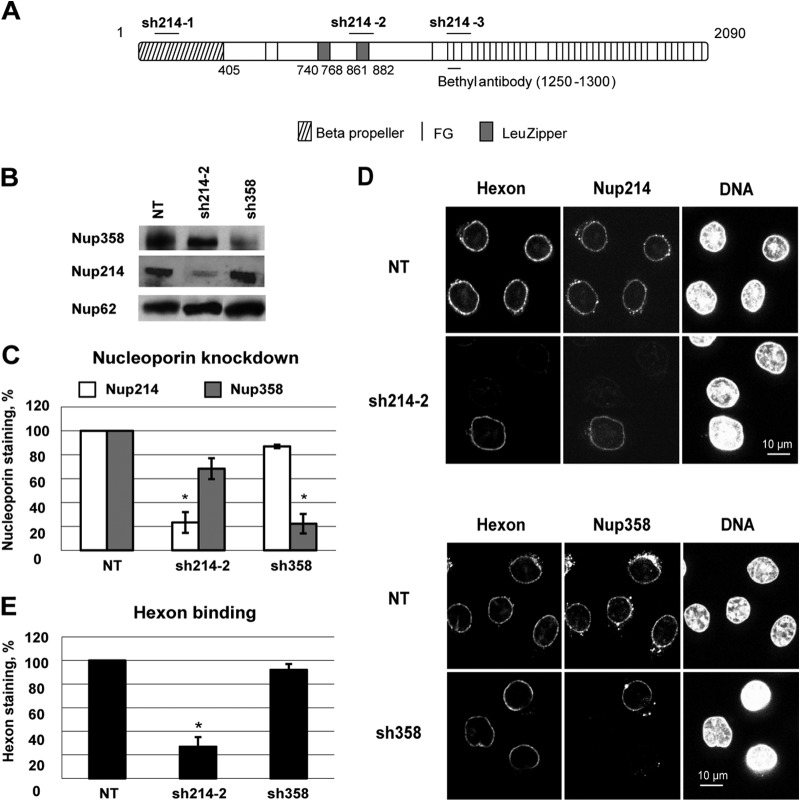
FIG 2.
Loss of hexon binding at the NE in Nup214-depleted HeLa cells. (A) Schematic representation of targeting sites of shRNA directed against Nup214 (short horizontal bars). Full-length Nup214 (aa 1 to 2090) is represented as a large horizontal bar. A short horizontal bar indicates the epitope recognized by anti-Nup214 antibody (bethyl antibody). (B) Knockdown in HeLa cells 48 h after transfection. Cells were transfected with shRNA expression plasmids against Nup214 (sh214-2) or against Nup358 (sh358) or were not transfected (NT). Total lysates of cells were analyzed by SDS-PAGE and Western blotting using RL1 antibody. Under each condition, the expression of Nup358, Nup214, and Nup62 (as an internal control) is shown. (C) Quantification of the knockdown in HeLa cells 48 h after transfection. Cells were transfected as described for panel A and stained for Nup214 and Nup358. The mean fluorescence intensity of endogenous Nup staining was measured at the whole circumference of the nucleus (n = 31 to 63 cells for each condition of each experiment). The histogram shows the mean fluorescence intensity of endogenous Nup214 or Nup358 staining compared to NT cells, fixed at 100% (*, P < 0.05). (D) Representative images of hexon binding at the NE. Purified hexon was added 48 h after transfection to digitonin-permeabilized HeLa cells of expression plasmids encoding shRNA against Nup214 (sh214-2) or against Nup358 (sh358) or no plasmid (NT). The cells were analyzed by IF staining to detect the hexon, Nup214 (upper panels), or Nup358 (lower panels). The nucleus was stained with DAPI. (E) Quantitative analysis of hexon binding at the NE. HeLa cells were treated as described for panel D. The mean fluorescence intensity of hexon staining at the whole circumference of the nucleus was measured (n = 31 to 63 cells for each condition of each experiment). The histogram shows the mean fluorescence intensity of hexon staining in knockdown cells and compared to NT cells, set at 100 (*, P < 0.05).

