
FIG 10.
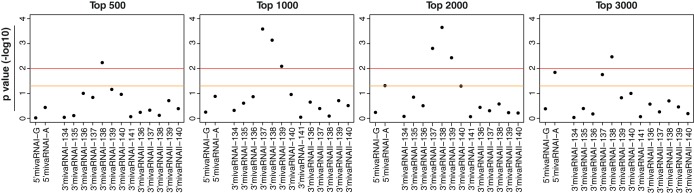
Overrepresentation of RNAs with seed sequence matches to VA RNAI- and VA RNAII-derived mivaRNAs among RNAs enriched in RISCs of Ad5-infected cells. Hypergeometric testing was performed to calculate significant overrepresentation of RNAs that were predicted by TargetScan to be targeted by a set of mivaRNA isoforms among the top 500, 1,000, 2,000, and 3,000 RNAs most highly enriched in RISCs of Ad5-infected cells compared to mock-infected cells. We tested RNAs with seed sequence matches to VA RNAI 5′-arm-derived single strands of mivaRNAI(G)-137 and mivaRNAI(A)-137, to VA RNAI 3′-arm-derived single strands of mivaRNAI-134, -135, -136, -137, -138, -139, -140, and -141, and to VA RNAII 3′-arm-derived mivaRNAII-136, -137, -138, -139, and -140. y axis, P values (−log10) representing the grade of overrepresentation of RNAs with seed sequence matches to the individual mivaRNAs within the sets of RNAs enriched in RISCs compared to the entire set of RNAs. The yellow line represents a P value of 0.05; the red line, a P value of 0.001.