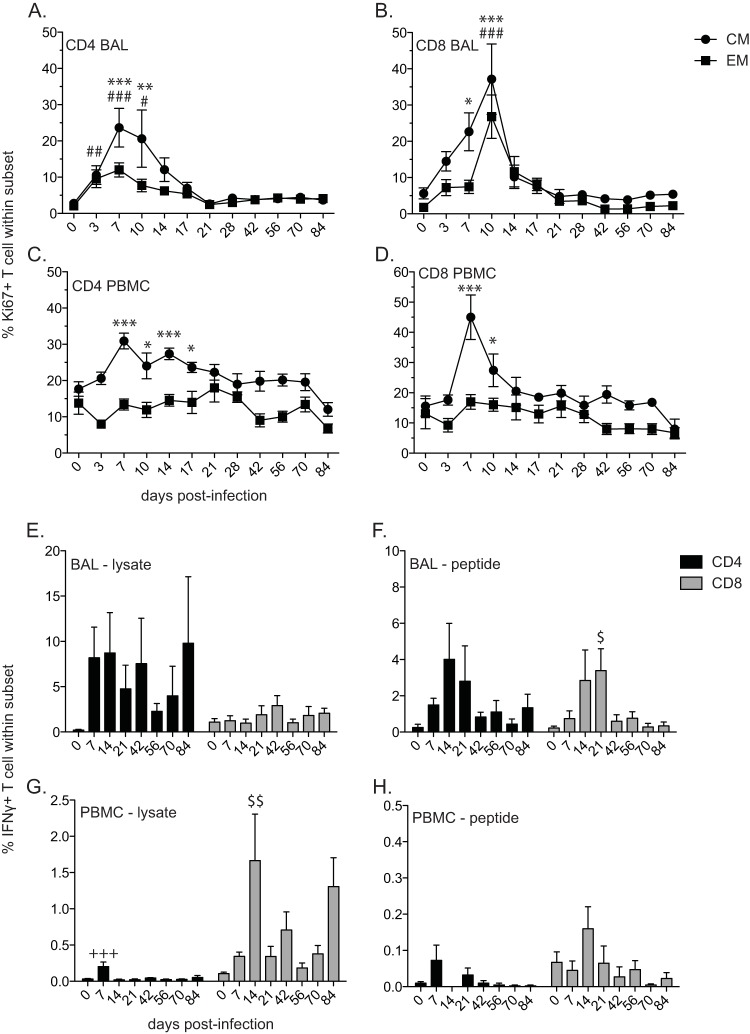
FIG 3.
VZV-infected rhesus macaques generate a T cell response. The frequencies of proliferating central memory (CM) and effector memory (EM) CD4 (A, C) and CD8 (B, D) T cell subsets were measured by flow cytometry based on the expression of Ki67 in BAL samples (A, B) and PBMC (C, D). The frequencies of VZV-specific CD4 and CD8 T cells producing IFN-γ in BAL samples (E, F) and PBMC (G, H) were measured by intracellular cytokine staining following stimulation with VZV lysate (E, G) or VZV peptides (F, H). The results shown are the average values ± SEM. Statistical analysis was performed using one-way repeated-measures ANOVA with Dunnett's posttest to assess differences between preinfection and postinfection values (P < 0.05: *, CM; #, EM; $, CD8; P < 0.01: **, CM; ##, EM; $$, CD8; P < 0.001, ***, CM; ###, EM; +++, CD4).

