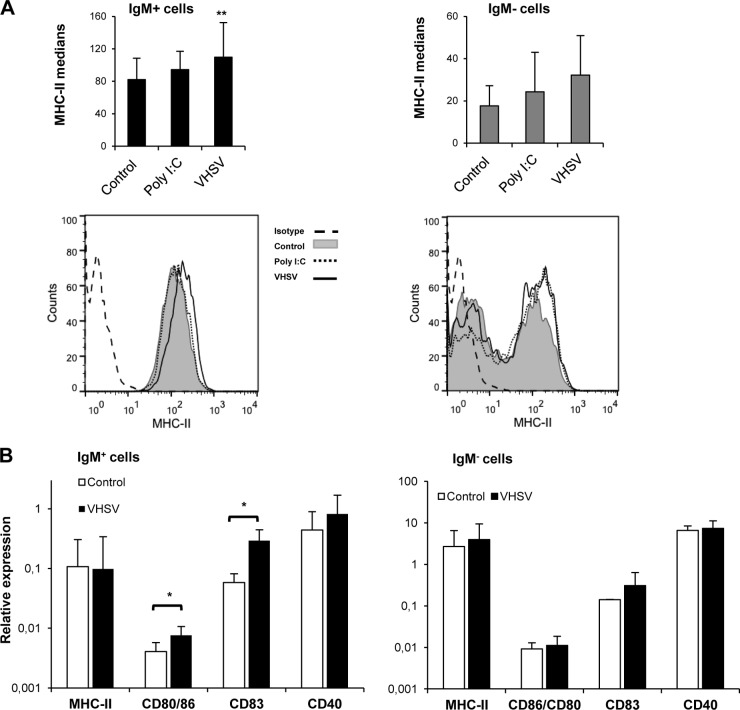
FIG 8.
VHSV activates IgM+ cells to an antigen-presenting phenotype. (A) MHC-II cell surface expression on IgM+ and IgM− cells after 48 h of incubation with poly(I·C) or VHSV. Data shown are mean fluorescence intensities ± standard deviations from 5 independent experiments. Representative histograms for both IgM+ and IgM− cells are shown at the bottom. (B) Splenocytes were stimulated as described in the legend of Fig. 1. IgM+ and IgM− cells were sorted after 24 h of incubation, and RNA was extracted for the evaluation of MHC-II, CD80/86, CD83, and CD40 transcription levels by real-time PCR (n = 5 to 7). Data shown are mean gene expression levels relative to the expression level of an endogenous control (EF-1α) ± standard deviations. *, P < 0.05.

