FIG 1.
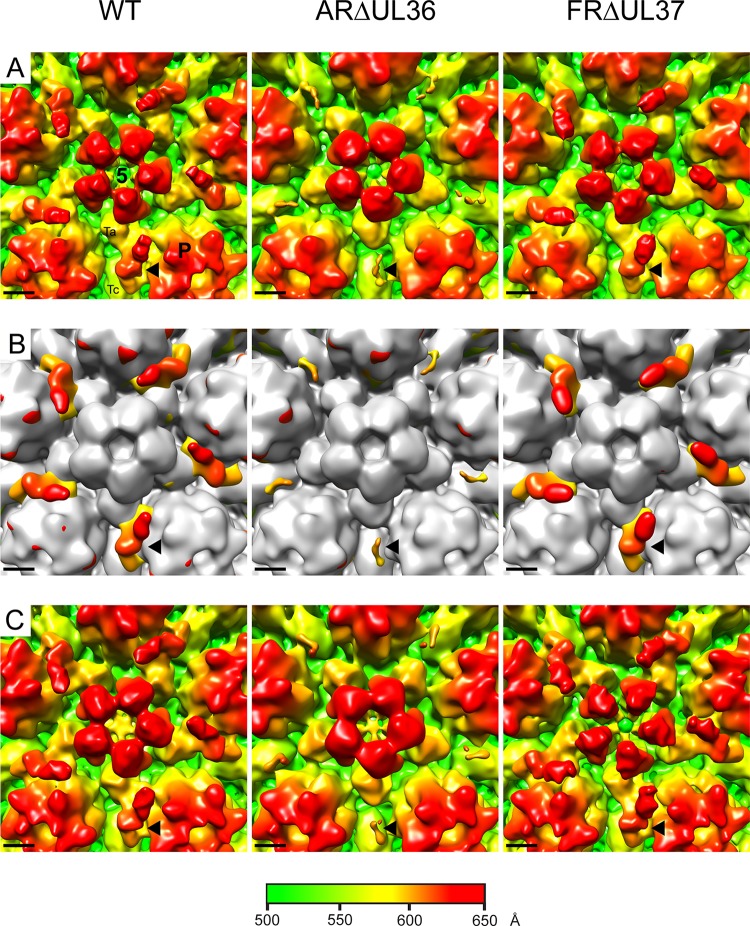
Comparison of CVSC densities in HSV-1 WT and mutant virus capsids. A region around the vertex (indicated by the white square in Fig. S1B in the supplemental material) of icosahedrally reconstructed C-capsids purified from the cytoplasm (A and B) or nucleus (C) of cells infected with WT HSV-1 or the inner tegument deletion mutants ARΔUL36 and FRΔUL37 is shown. Panels A and C are shown radially colored. Panel B shows the cytoplasmic C-capsid maps in panel A superimposed on a B-capsid map (shown in gray). The locations of the penton (5), one of the five peripentonal hexons (P), and a Ta and Tc triplex are marked on the WT image in panel A. Each black arrowhead indicates the position of one CVSC density. Scale bar = 50 Å.

