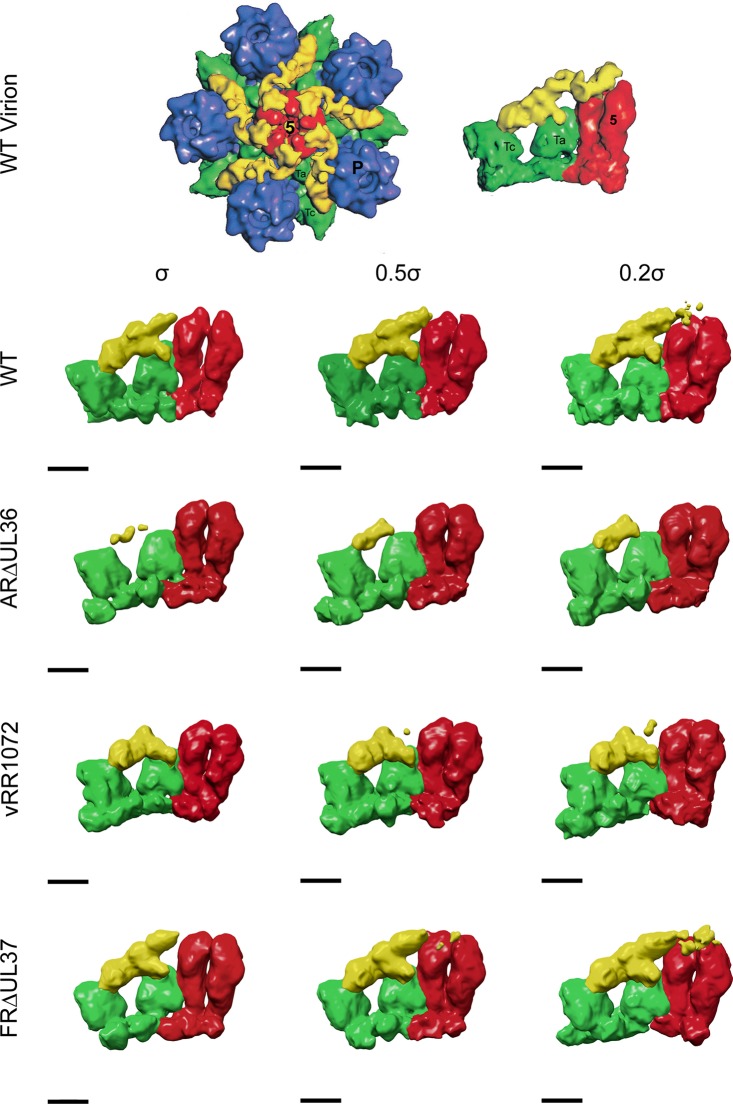
FIG 5.
CVSC density on WT and FRΔUL37 capsids is threshold sensitive. The WT virion maps are reproduced from Fig. 4 of reference 28. The original images have been flipped 180° to show them in the correct hand. The left side shows one vertex from an icosahedrally reconstructed WT HSV-1 virion map, comprising the penton (red), surrounding P hexons (blue) and Ta and Tc triplexes (green), and the star-shaped CVSC/tegument density (yellow). The right side shows an enlarged side view of one CVSC/tegument density with two associated penton subunits and triplexes Ta and Tc. Equivalent regions from the WT, ARΔUL36, vRR1072, and FRΔUL37 cytoplasmic C-capsid maps are shown similarly colored for comparison. The C-capsid maps are shown at thresholds above the mean + 1 σ, mean + 0.5 σ, and mean + 0.2 σ (from left to right, respectively). Scale bar = 50 Å.

