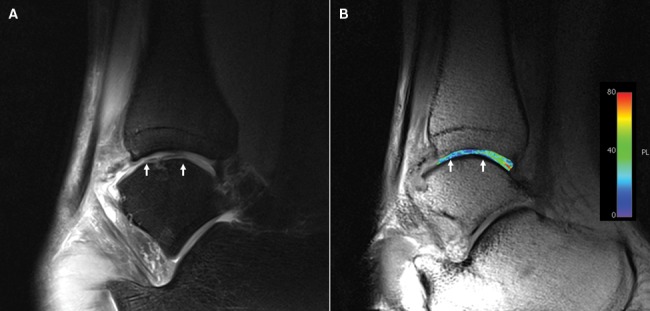
Figure 2.

(A) Morphologic sagittal proton density-weighted image and (B) corresponding T2 map. Subchondral alterations are visible in the area of the repair site (white arrows). A homogeneous distribution of T2 values throughout is found, but values are lower at the repair site.
