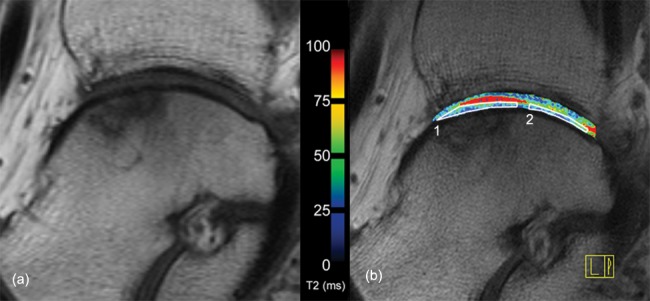
Figure 2.

Morphological T1-weighted spin echo image (A) and corresponding T2-map (B) of case 7. Subchondral alterations are visible in the area of the repair site. Synovial fluid is seen between talar and tibial cartilage in the T2-map (red area, corresponding to Fig. 1); however, the repair site shows a complete covering of the defect and a homogeneous distribution of T2 values throughout the cartilage layers. The white boxes indicate how the regions of interest (1, repair tissue; 2, reference cartilage) were placed for T2 assessment.
