
Figure 4.
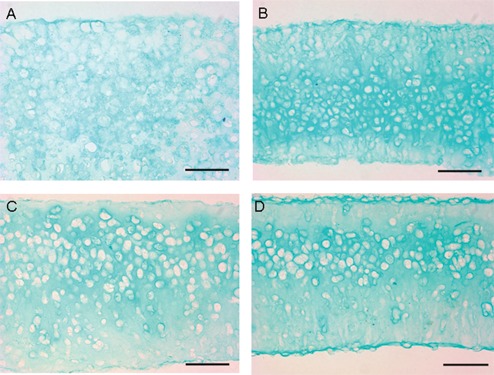
Demonstration of proteoglycan distribution as shown by staining with Alcian blue for GAG chains. Representative CTA at 1 week (A and B) and CTA at 3 weeks (C and D). A and C are unloaded; B and D are loaded. Images were photographed at 40x; bar represents 50 µM.