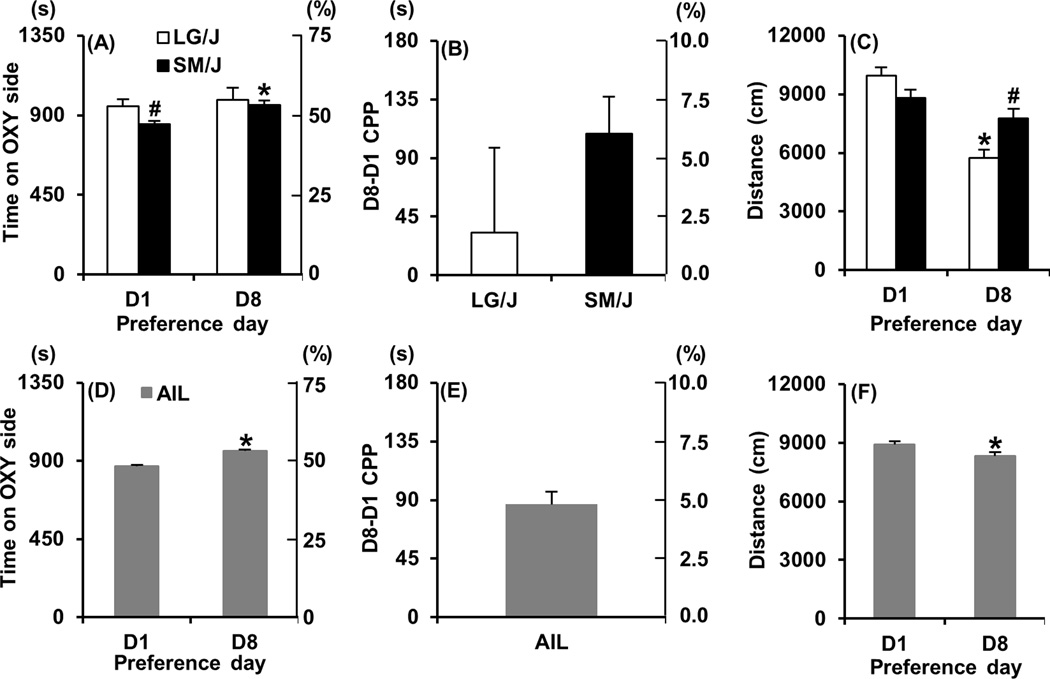
Figure 2. OXY-CPP in LG/J, SM/J, and AIL mice.
Panels A, D. Time spent on the OXY-paired side before training (Day 1; D1) and following OXY-CPP training (Day 8; D8) in LG/J (white bars), SM/J (black bars), and AIL mice (gray bars). The y-axes represent both the seconds (s) and % time on the OXY-paired side. Panels B, E: Change in time spent on the OXY-paired side between D1 and D8 (D8-D1 CPP). The y-axes represent both the difference in seconds and the difference in % time on the OXY-paired side. Panels C, F: Total distance traveled on D1 and D8 in LG/J (white bars), SM/J, (black bars) and AIL mice (gray bars). * = significantly different from D1 (Panels A, C, D, F). “#” = significantly different from LG/J (Panels A, C). Data are represented as the mean ± S.E.M.

