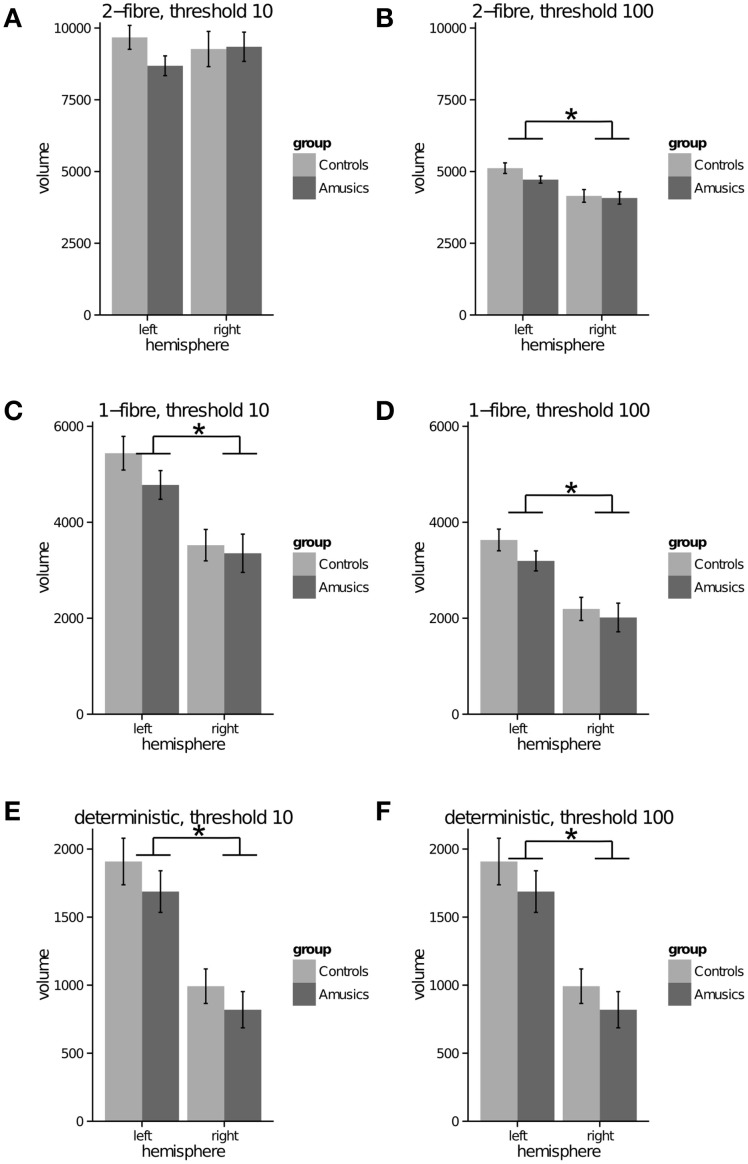
Figure 3.
Arcuate fasciculus (to premotor cortex) tract volume (mm3) (y-axis) in left and right hemispheres (x-axis) for control and amusic individuals. (A) probabilistic 2-fiber model, data thresholded at 10; (B) probabilistic 2-fiber model, data thresholded at 100; (C) probabilistic 1-fiber model, data thresholded at 10; (D) probabilistic 1-fiber model, data thresholded at 100; (E) deterministic model, data thresholded at 10; (F) deterministic model, data thresholded at 100. * represents a significant main effect of hemisphere, p < 0.001.

