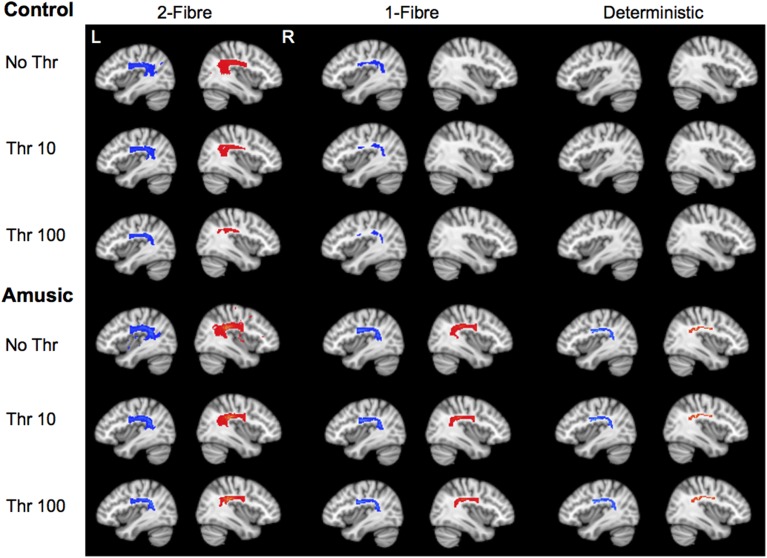
Figure 4.
Tractography results for one control and one amusic individual, for each tractography algorithm. Results are presented at no thresholding, threshold of 10, and threshold of 100, overlaid on the standard MNI template (thresholding scale from 0 to 24500). L, left, x = −38; R, right, x = 38. In this sample control individual, fiber tracking failed in the right hemisphere for the 1-fiber model, and in both hemispheres in the deterministic model.

