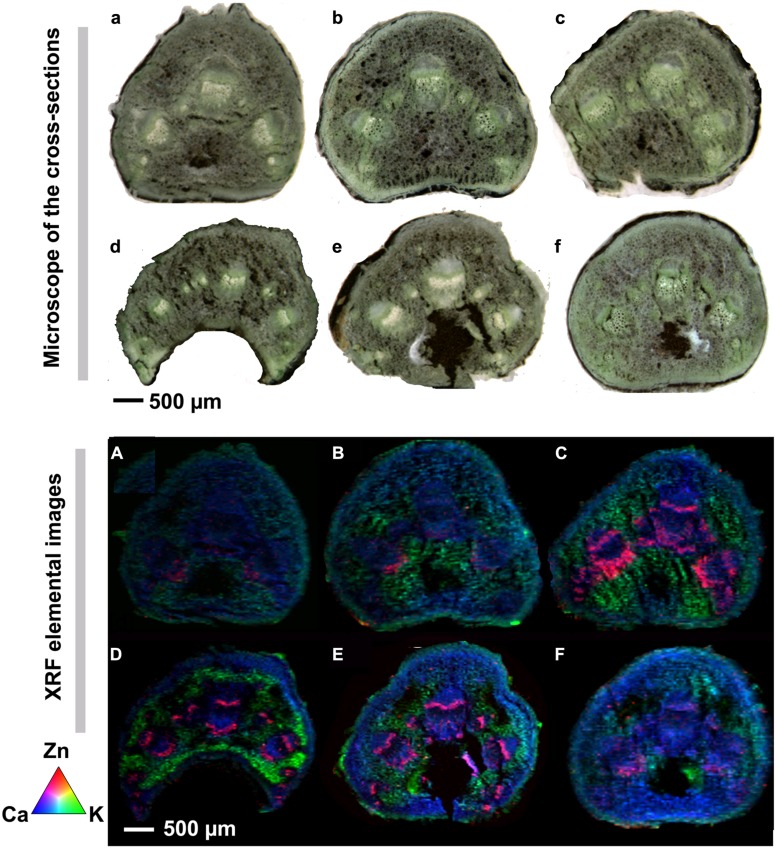
FIGURE 2.
Microscope cross sections (a–f) and μ-XRF elemental maps (A–F) for Zn (red), Ca (green), and K (blue) of petioles collected from sunflowers subject to different foliar fertilizers. Cross-sections of leaf veins were cut from sunflower plants treated with (a, A) control, (b, B) CleanStart, (c, C) Kick-Off, (d, D) CleanStart + Kick-Off, (e, E) CleanStart + Kick-Off + GroZyme, and (f, F) ZnSO4, and then analyzed by μ-XRF imaging. Compositions of the nutrients in different treatments are shown in Table 1. Pixel brightness for μ-XRF map (A–F) is displayed in RGB, with the brightest spots corresponding to the highest element fluorescence. Scale bar: 500 μm.

