
Table 1.
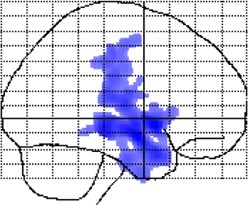
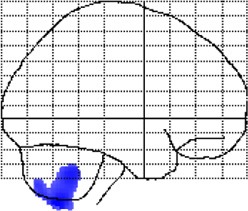
Cluster-specific details for significant group-by-age interactions (local gray matter).
| Cluster | Number of voxels | Volume (ml) | Significance maximum (T) | Significance maximum (x, y, z) | Brain regions |
|---|---|---|---|---|---|
| C1 | 20,019 | 67.56 | 3.89 | −42, −84, −17 | Hippocampus/amygdala (L) |
 |
Medial (B) lateral (L) occipital cortex | ||||
| Medial (L) lateral (L) parietal cortex | |||||
| Posterior cingulate (L) | |||||
| Central sulcus (L) | |||||
| C2 | 8,539 | 28.82 | 3.59 | 60, −4, −12 | Sylvian F. w/operculum + insula (R) |
 |
Lateral temporal cortex (R) | ||||
| Inferior parietal cortex (R) | |||||
| Central sulcus (R) | |||||
| C3 | 2,986 | 10.08 | 2.99 | 2, 48, −12 | Orbital gyrus (B) |
 |
Anterior cingulate gyrus (B) | ||||
| Medial superior frontal gyrus (B) | |||||
| C4 | 2,825 | 9.53 | 3.91 | −52, −24, 10 | Sylvian F. w/operculum + insula (L) |
 |
Temporo-parietal junction (L) | ||||
| C5 | 1,856 | 6.26 | 3.19 | −6, −4, 51 | Mid cingulate gyrus (B) |
 |
Medial superior frontal (B) | ||||
| C6 | 1,542 | 5.20 | 2.70 | −18, −61, −60 | Cerebellum (B) |
 | |||||
| C7 | 1,368 | 4.62 | 3.25 | 51, −75, −12 | Lateral occipital cortex (R) |
 | |||||
| C8 | 1,360 | 4.59 | 3.47 | 2, −4, −2 | Hypothalamus (B) |
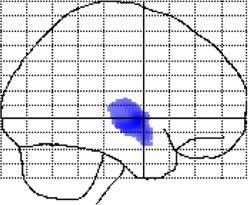 |
Medial thalamus (B) | ||||
| C9 | 1,131 | 3.82 | 3.42 | 38, −45, 49 | Lateral parietal cortex (R) |
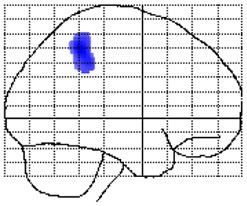 |
L, left hemisphere; R, right hemisphere; B, both hemispheres.