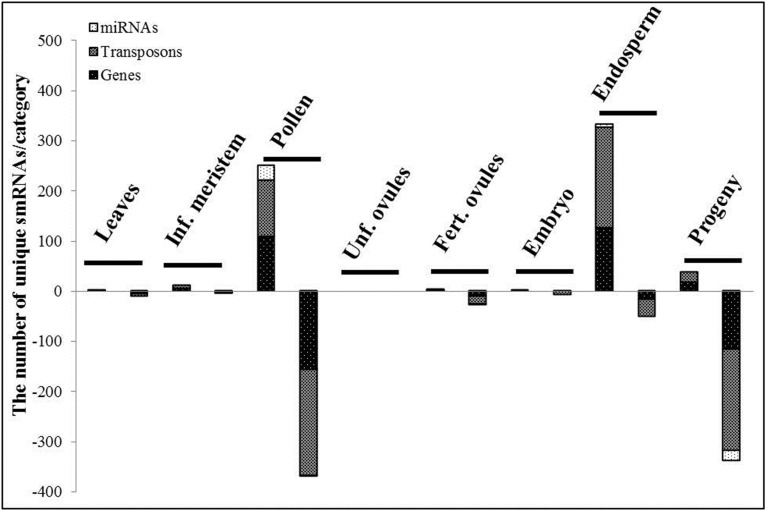
Figure 4.
The differentially expressed small RNAs, TR vs. CT. The stacked bars represent the number of the unique differentially expressed smRNAs per category in the corresponding tissue. SmRNAs were divided into 3 categories regarding the genome regions they were mapped to: miRNAs, transposon and gene regions. The first and second stacked bars show the number of smRNAs with the positive and negative log2fold change values (TR vs. CT) in the corresponding tissue, respectively (the Benjamini-Hochberg method, q < 0.2).

