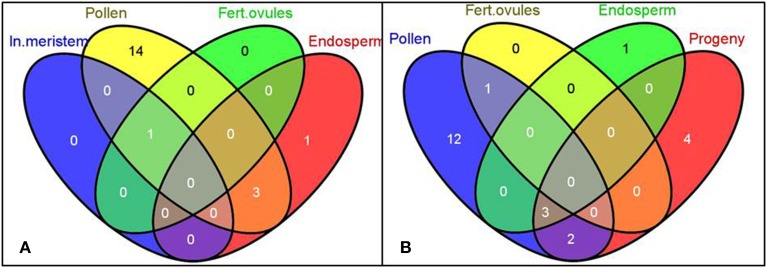
Figure 7.
The Venn diagrams representing the common microRNA gene families of differentially expressed mature miRNAs among tissues in heat-stressed B. rapa plants as compared to controls. The differentially expressed smRNAs mapped to conservative miRNAs (TR vs. CT, q < 0.2, the Benjamini-Hochberg method) were grouped into microRNA gene families and used for the generation of Venn diagrams using the Venny software. Labels: In. meristem—Inflorescence meristem, Fert. ovules—Fertilized ovules. (A,B) Comparison of common microRNA gene families of differentially expressed mature miRNAs among denoted tissues.

