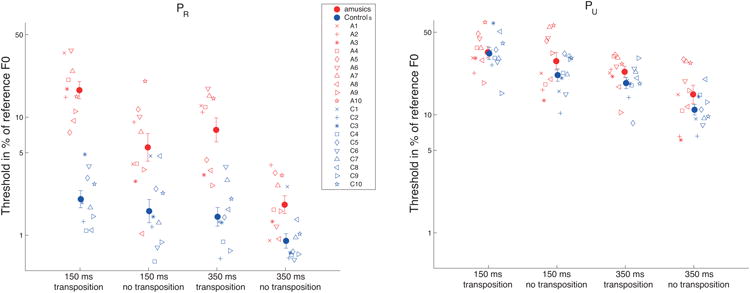
Figure 2.

Results of Experiment 1. A) Mean and individual difference limens for the resolved pitch (PR) stimuli. In both panels, the closed symbols represent mean results for the amusic (red) and the control (blue) groups. The open symbols represent individual data and are consistent throughout all the figures of the paper. Results of the four different subconditions are plotted: from left to right 1) short tone duration (150 ms) and presence of transposition; 2) short tone duration and absence of transposition; 3) long tone duration (350 ms) and presence of transposition; 4) long tone duration and absence of transposition. Here and in subsequent figures, error bars represent +/- standard error about the mean. B) Same for unresolved pitch stimuli (PU).
