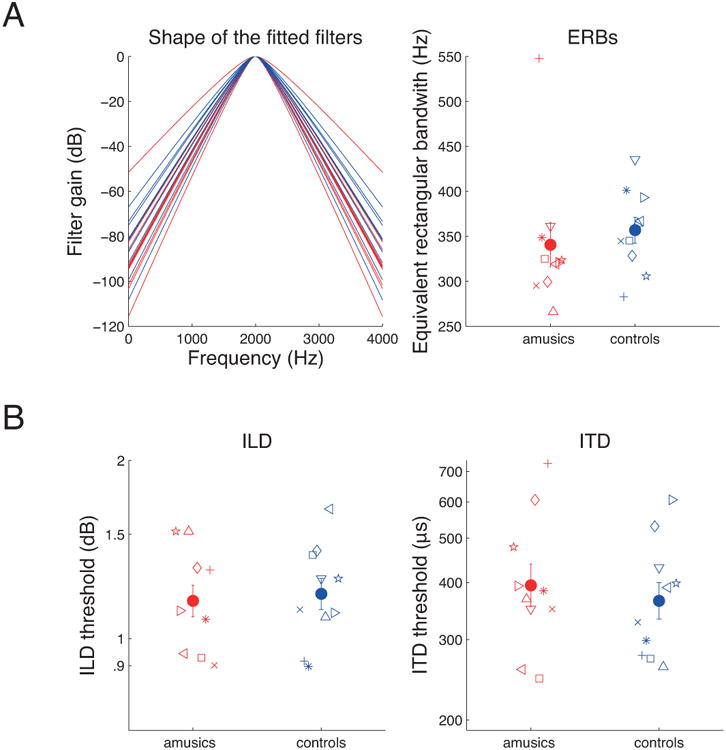
Figure 3.

Results of Experiments 2 and 3. A) Masked thresholds in the three spectral notch conditions (see methods) were used to fit a simple symmetric rounded-exponential filter shape to the data from each subject. Individual filter shapes are depicted in the left panel, and mean (closed symbols) and individual (open symbols) equivalent rectangular bandwidth are depicted in the right panel in red for amusics and in blue for controls. B) Mean (closed symbols) and individual (open symbols) difference limens for Interaural Level Difference (ILD, left panel) and Interaural Time Difference (ITD, right panel).
