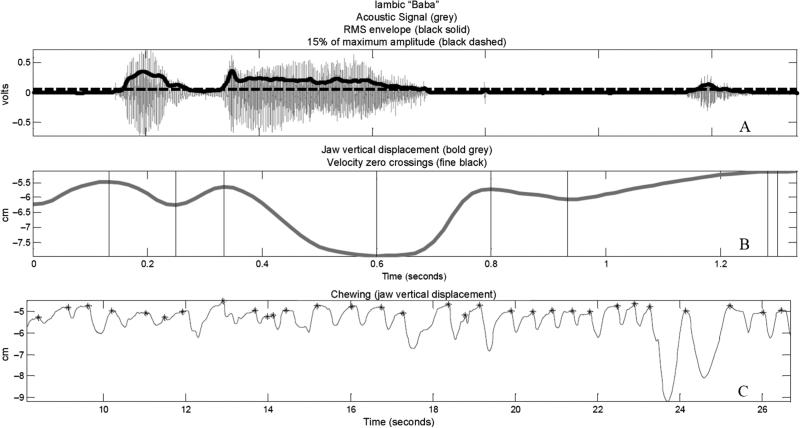
Figure 2.
Panels A and B plot acoustic and kinematic data, respectively, for an iambic production of baba. In Panel A, the amplitude envelope is plotted in solid black, and 15% of the maximum amplitude is plotted as a dashed line. The beginning and end of vowels were parsed algorithmically at the intersection of these lines. Panel B is a plot of the vertical displacement of the jaw marker for the same production. The vertical lines are the velocity zero crossings used to parse the kinematic signals. Panel C shows the vertical displacement of the jaw of the same participant while chewing a cracker. Asterisks mark the closing landmarks that were selected algorithmically for the trial. RMS = root-mean-square.

