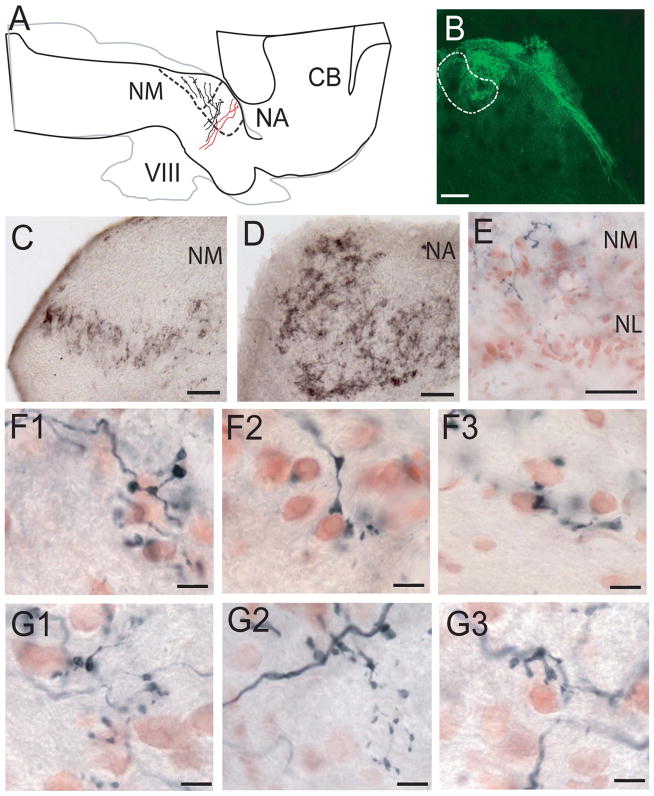
Figure 2.
Schematic drawing and photomicrographs showing projections of the auditory nerve to NM and NA. A: Horizontal drawing of the gecko brainstem with lower frequency fibers (black) that entered the brainstem and bifurcated to terminate in NM and NA, whereas higher best-frequency fibers (red) projected to medial NA. The gray outline shows a more ventral section at the level of the nerve root, and the black outline is at the level of the first-order nuclei. B: Confocal image stack of a transverse section showing fibers labeled by FITC-DA injected into auditory nerve, which terminated in the dorsolateral NM neuropil. C: Terminals in NM labeled by injection of CTX to the auditory nerve. D: Terminals in NA labeled by injection of CTX to the auditory nerve. E: Labeled auditory nerve fibers in NM but not NL. F: Relatively large terminal endings in NM. G: Small bouton terminals in NA. Scale bars = 200 μm in B; 50 μm in C–E; 10 μm in F,G. [Color figure can be viewed in the online issue, which is available at wileyonlinelibrary.com.]

