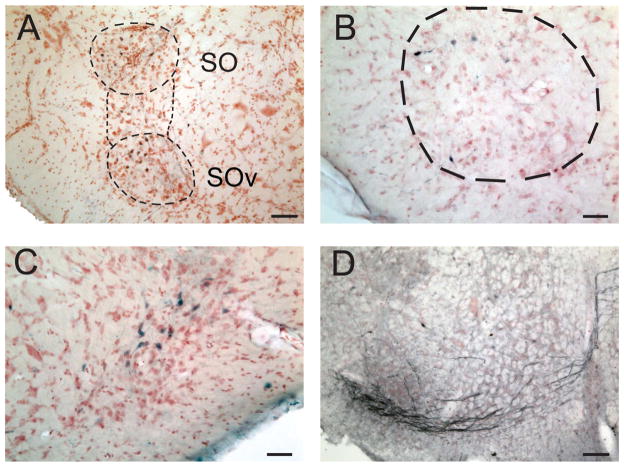
Figure 7.
Profile and structures of SOv and its relationship to SOd. A: Injection of NB in SOd labeled neurons in the ipsilateral SOv and neurons in the region between SOd and SOv. B: Neurons labeled in SOv after an injection of NB into the contralateral NM. C: Neurons labeled after NB injection into contralateral NL. D: Thick axons labeled after an NB injection in NA projected to the contralateral SOv. Scale bars = 100 μm in A,D; 50 μm in B,C. [Color figure can be viewed in the online issue, which is available at wileyonlinelibrary.com.]

