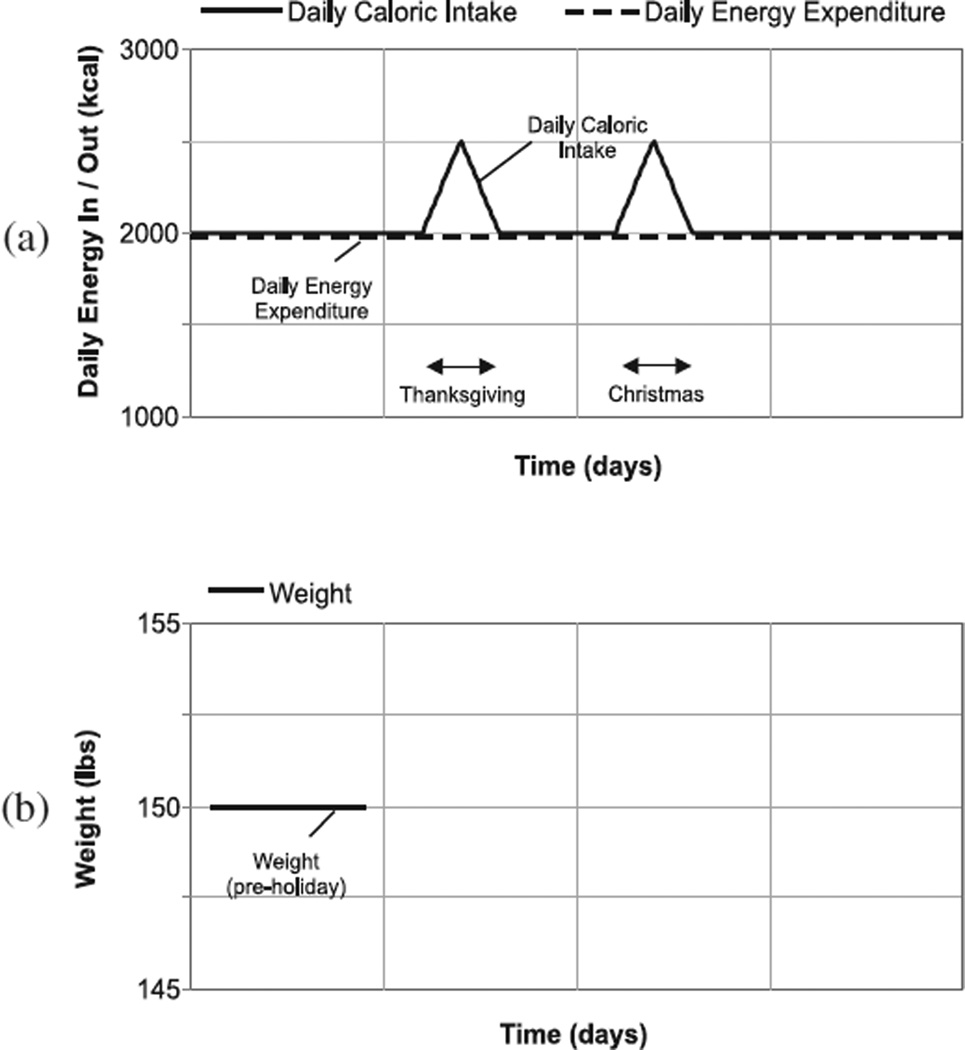
Fig. 2.
Standardized exercise sheet. Graph (a) shows the eating behavior of a hypothetical individual during the holiday season. Initially—before the holiday season—assume that she kept her weight steady at 150 lbs, with daily caloric intake (and expenditure) at 2000 kcal. This steady situation changes, however, during the holidays when—like most people—her caloric intake increases by as much as 25 percent. Specifically, assume that her food intake progressively rises—as shown in (a)— peaking at 2500 kcal/day on Thanksgiving Day, and then declines back to 2000 kcal/day. The pattern repeats during Christmas. To simplify things, we’ll assume her energy expenditure remains constant at the 2000 kcal/day level

