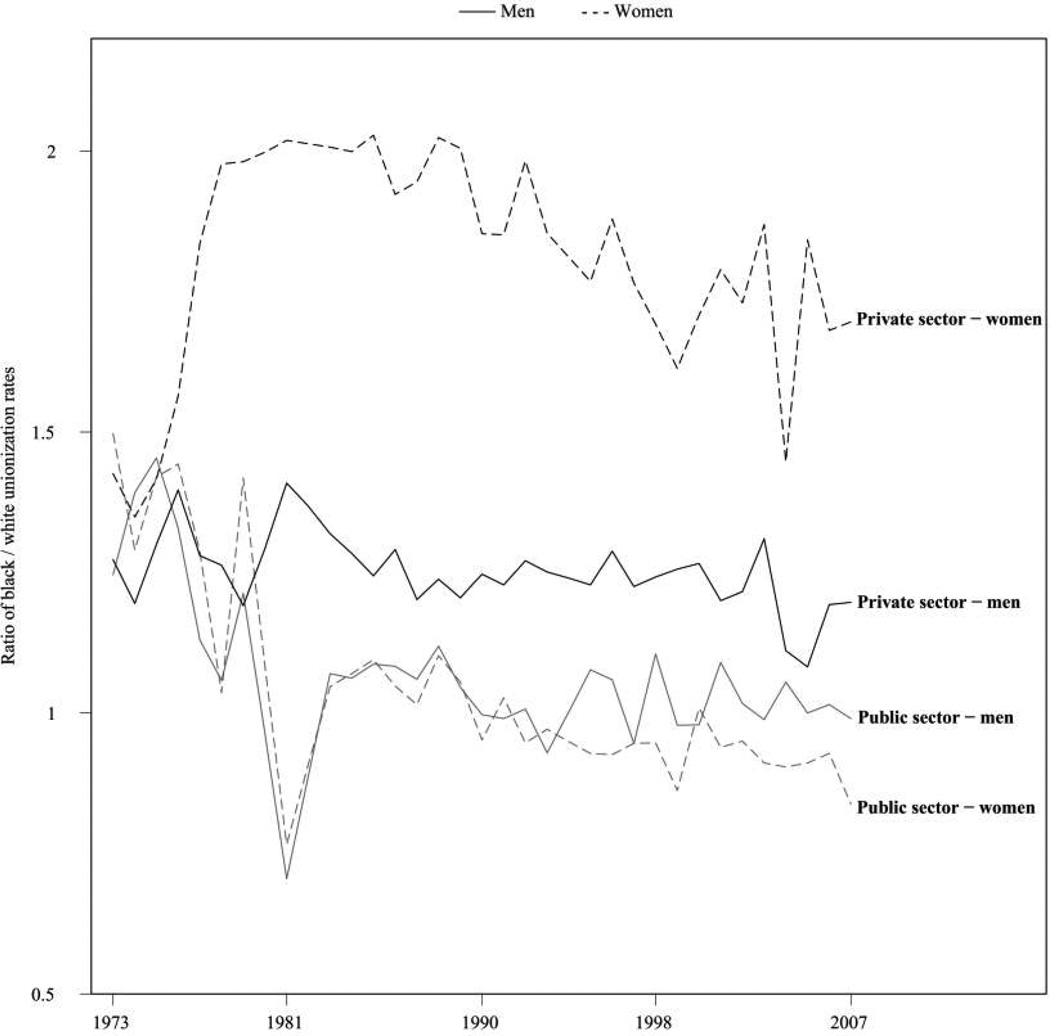
Fig. 1.
Ratio of black/white unionization rates by economic sector, 1973–2007. Data for 1973–81 come from the CPS-May files; data for 1983–2007 come from the CPS-MORG files. Unionization rates for 1980, 1982, and 1994 are unavailable: we estimate rates for the missing years by averaging the prior and subsequent year’s rates. We multiply the 1973–76 unionization rates by 1.094 to reflect changes in CPS wording on the union question (Hirsch, MacPherson, and Vroman 2001, p. 51). Estimates are adjusted using appropriate CPS weights. See the data and methods section and the data appendix for further details.

