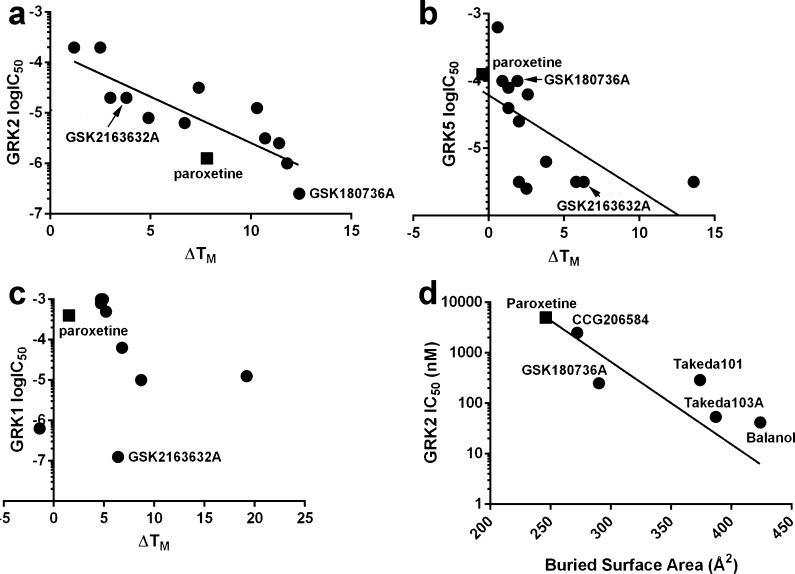
Figure 2.
GRK2 and 5 inhibitor potency correlates with ΔTm and buried surface area. Compounds with undetermined IC50 values in Table 2 are omitted. (a) ΔTm of GRK2 is strongly correlated (Pearson’s r = −0.833, P = 0.0004) with potency. (b) ΔTm of GRK5 is also significantly correlated (r = −0.6309, P = 0.0156). (c) ΔTm of GRK1 does not, however, correlate (r = −0.091). (d) Buried surface area of small molecules crystallized in complex with GRK2 is significantly correlated with their potency (r = −0.787, P = 0.0316). In each panel, paroxetine is denoted by a square.

