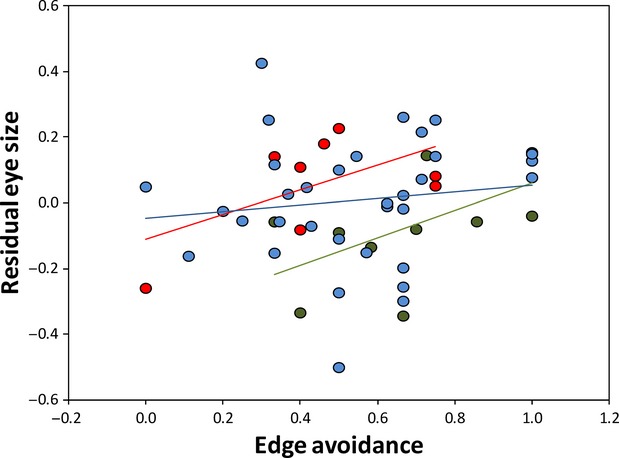
Figure 2.

Plots showing the relationship between residual eye volume (corrected for body size) and our measure of edge avoidance for canopy (blue marks), middle stratum (green) and understory (red) birds. Data points are residuals from a regression of eye volume on body size and thus are not phylogenetically corrected. Regression lines for illustration only, slopes from the model are as follows: understory: 0.32 (0.12); medium stratum: 0.17 (0.08); and canopy: 0.12 (0.06). Slope comparisons, all Z < 1.4, P > 0.08.
