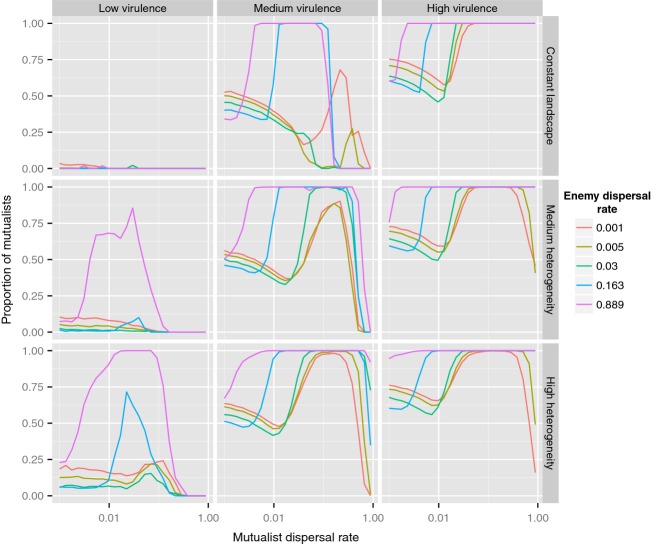
Figure 3.
Proportion of mutualists over the whole landscape in the spatially explicit model. Relative virulence (α) varied in {0.1, 0.2, 0.3}, and the amount of heterogeneity in the distribution of patches growth rate (see main text) varied in {0, 0.5, 1}. As predicted in the two-patch analytical model, increased heterogeneity and dispersal rates allow the stable persistence of both mutualists and enemies, in some cases leading to the exclusion of enemies at the global scale.

