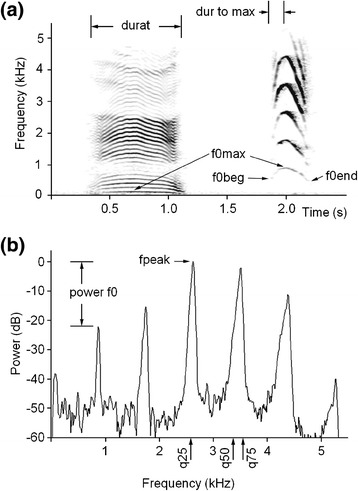
Figure 1.

Measured acoustic variables. (a) Spectrogram of a hind nasal call (left) and a calf oral call (right). (b) Mean power spectrum of 50 ms fragment of a calf call. Designations: durat – call duration; dur-to-max – duration from call onset to the point of the maximum fundamental frequency; f0max – the maximum fundamental frequency; f0beg – the fundamental frequency at the onset of a call; f0end – the fundamental frequency at the end of a call; fpeak – the frequency of maximum amplitude within a call; power-f0 – the relative power of the f0 band compared to the peak harmonic; q25, q50 q75 – the lower, the medium and the upper quartiles, covering respectively 25%, 50% and 75% energy of a call spectrum. The spectrogram was created with Hamming window; 11025 kHz sampling rate; FFT 1024 points; frame 50%; and overlap 96.87%.
