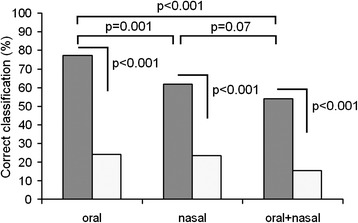
Figure 2.

Individual discrimination of hinds based on oral calls, nasal calls, and the pooled call sample. Gray bars indicate values of discriminant function analysis (DFA) and white bars indicate random values, calculated with the randomization procedure. Comparisons between observed and random values and between oral calls, nasal calls, and the pooled sample of oral and nasal calls with χ 2 tests are shown by brackets above. Examples of nasal calls of four individual hinds are given in Additional file 1.
