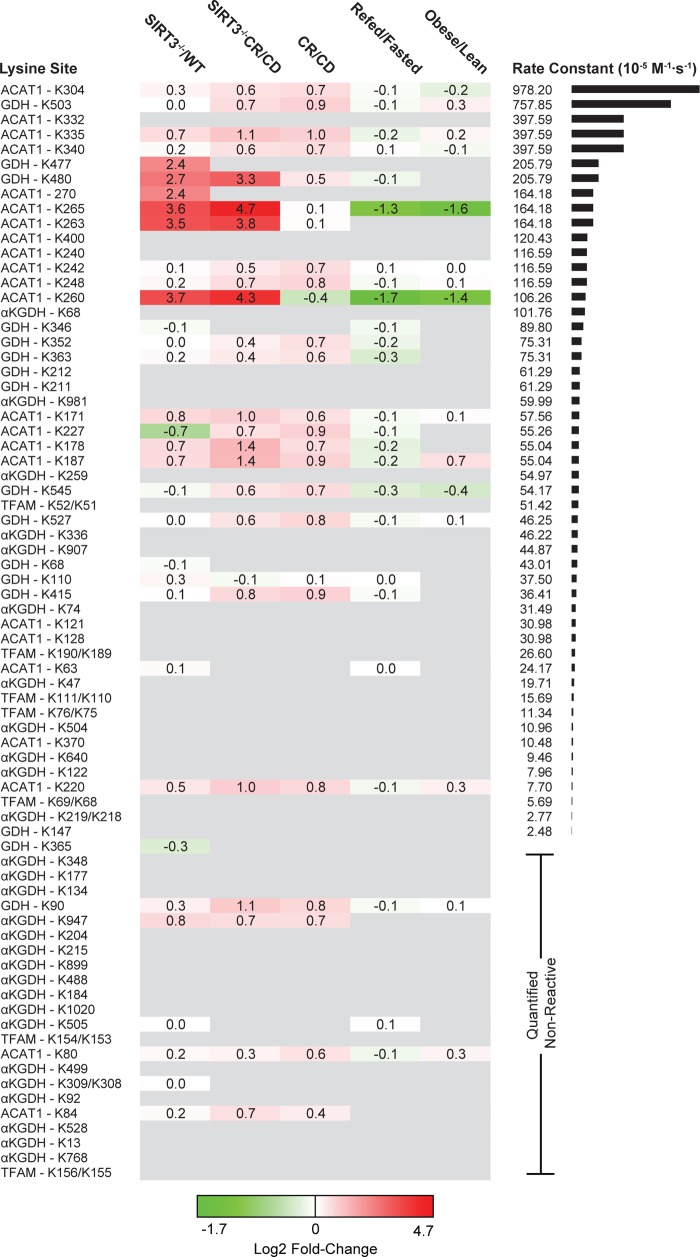
Figure 3.
Lysine site reactivity mapped to acetylation fold-change proteomics. Heatmap of observed sites ranked from high to low reactivity across five experimental conditions. CD: control diet. CR: calorie restriction. Acetylation fold-change values were compiled from previous studies of mouse liver mitochondria and MEF cells. Mouse protein sites that differ in sequence number from observed proteins are identified by both sites: K[site]obs/K[site]Musmusculus. Quantified nonreactive sites are randomly ordered. Sites with high reactivities are more likely to be found in the acetylation data sets.

