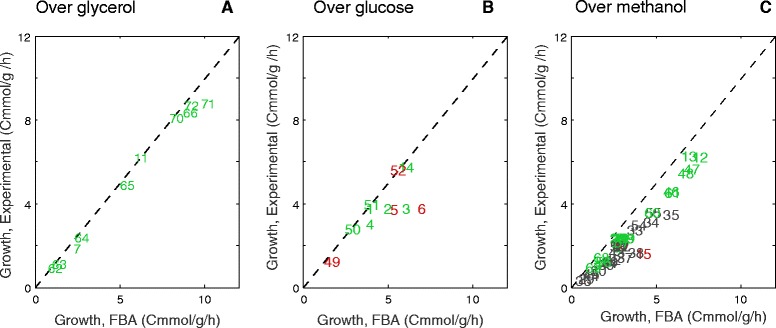
Figure 2.

FBA growth predictions vs. experimental growth. Comparison of predicted growth and experimental growth for each dataset with different substrates as carbon sources: A) glycerol, B) glucose, C) methanol and methanol-glycerol mixtures. Green labels represent consistent datasets, whereas red ones are those classified as inaccurate. Gray represents those in which the carbon balance could not be checked.
