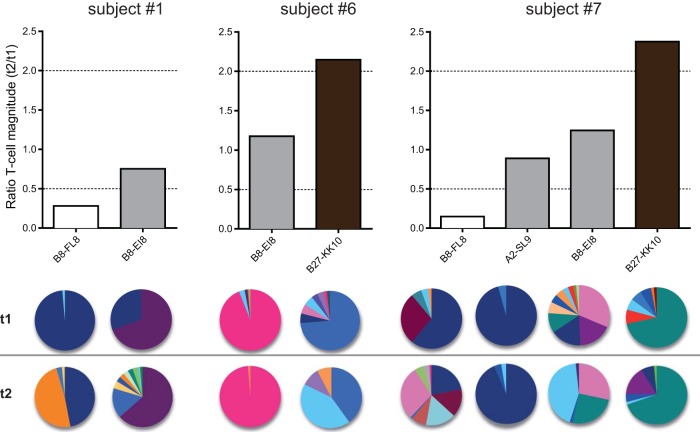
FIG 5.
CD8+ T-cell response evolution is not dependent on the individual. Antigen-specific CD8+ T-cell responses were stratified according to subject origin. Bar colors in the upper panel are adapted from Fig. 4 and represent decreasing (white), stable (gray), and increasing (black) response magnitudes over time. The clonotypic composition of each CD8+ T-cell population is illustrated in the pie charts. Each color in a pie chart represents a unique clonotype. Pie chart colors match clonotypes for each epitope pair but do not correspond between pairs.

