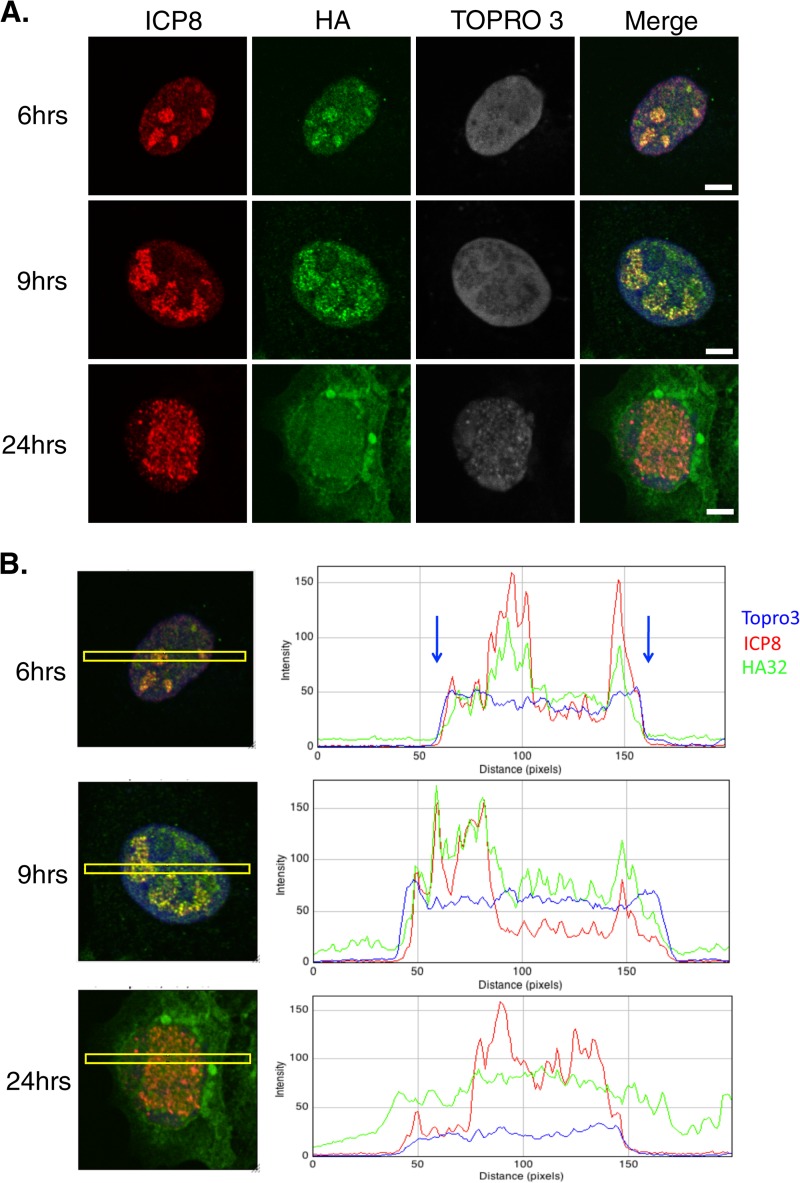
FIG 2.
UL32 changes localization during infection. (A) Vero cells were infected with HA32 at an MOI of 0.1. At 6, 9, and 24 h postinfection, cells were fixed in 4% paraformaldehyde and permeabilized in acetone, followed by staining for ICP8 (red, mouse antibody) and HA (green, rat antibody). TOPRO3 staining was performed to visualize the nucleus. Bars = 5 μm. (B) The merged images in panel A were analyzed by ImageJ software. Yellow boxes, the area used to measure fluorescent intensity; blue arrows, the edges of the nucleus indicated by TOPRO3 staining. At least 100 cells were examined at each time point, and the staining patterns shown in all three panels represent those seen in nearly all cells on the coverslip.

