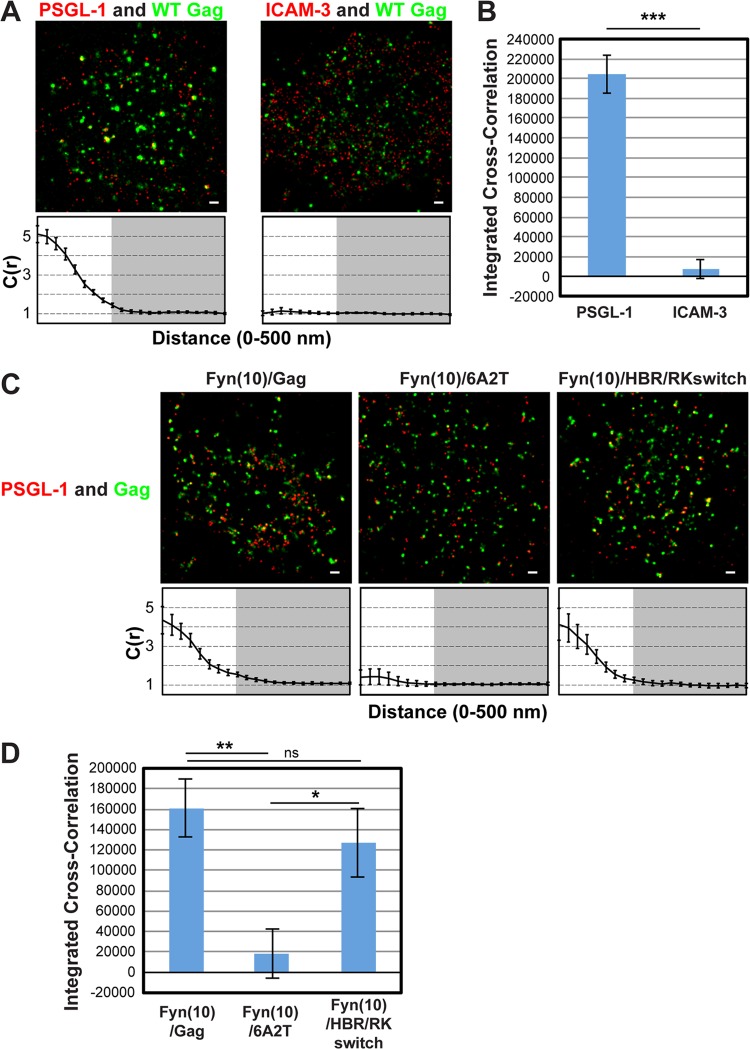
FIG 1.
Two-color superresolution microscopy analysis detects MA HBR-dependent coclustering of Gag with PSGL-1 in T cells. (A) A3.01 cells infected with VSV-G-pseudotyped HIV-1 whose genome encodes the Gag-mEos3.2 fusion protein were plated onto fibronectin-coated coverslips, fixed, immunostained for PSGL-1 or ICAM-3 with Alexa Fluor 647-labeled monoclonal antibodies, and imaged by TIRF microscopy in a reducing buffer (at least 5,000 image frames per cell). Representative reconstructed images were produced as described in Materials and Methods. Images show Gag-mEos3.2 in green and PSGL-1 and ICAM-3 in red. Cross-correlation measurements were performed using images of a total of at least 15 cells per condition. Curves below the images represent mean cross-correlation [C(r)] values at distances ranging from 0 to 500 nm. The range that is not shaded corresponds to 0 to 200 nm, which was used for the calculation of total coclustering in panel B. (B) Total coclustering was calculated by integrating the area under the cross-correlation curves from 0 to 200 nm, as described in Materials and Methods. The values shown indicate means ± SEMs. ***, P < 0.0005. (C) A3.01 cells were infected with VSV-G-pseudotyped viruses whose genomes encode the indicated Fyn(10)/Gag-mEos3.2 derivatives and analyzed as described in the legend to panel A. (D) The analysis of total coclustering was performed as described in the legend to panel B using cross-correlation curves for images of a total of 9 to 15 cells. **, P < 0.005; *, P < 0.05; ns, not significant. The fields shown in panels A and C are 10 μm by 10 μm. Bars = 500 nm.

