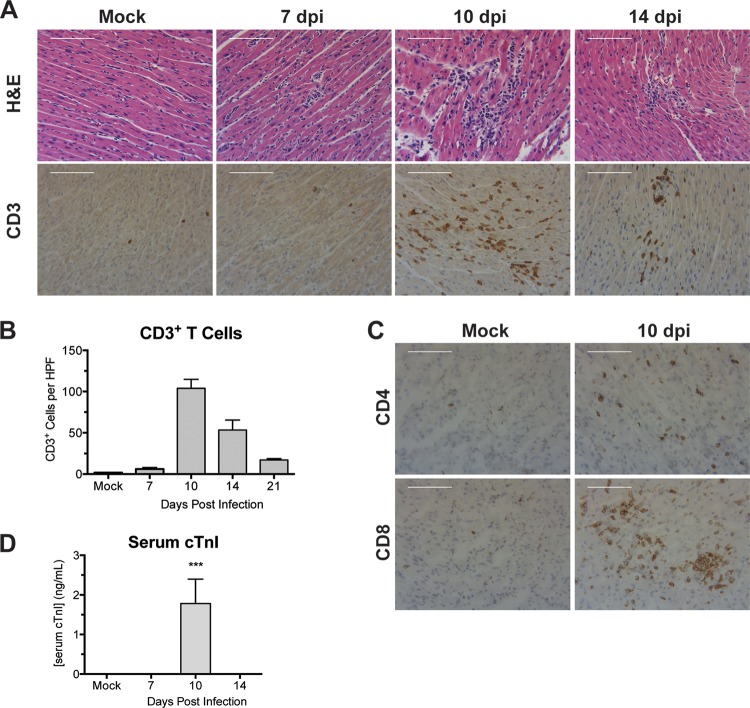
FIG 2.
Cellular inflammation in hearts of infected neonatal mice. Mice were infected with MAV-1 or mock infected with conditioned medium. (A) Hematoxylin- and eosin-stained or CD3-stained sections were prepared from paraffin-embedded sections. Scale bars, 100 μm. (B) CD3 staining was quantified by counting the number of CD3+ cells per high-power field, averaging three fields per individual mouse. Combined data from 3 to 5 mice per group are presented as means ± SEM. (C) CD4- and CD8-stained sections were prepared from hearts of infected neonatal mice at 10 days p.i. Scale bars, 100 μm. (D) Serum cTnI levels were measured by ELISA. Combined data from 4 to 6 mice per group are presented as means ± SEM. ***, P < 0.001, comparing mock to MAV-1 infection.

