FIG 5.
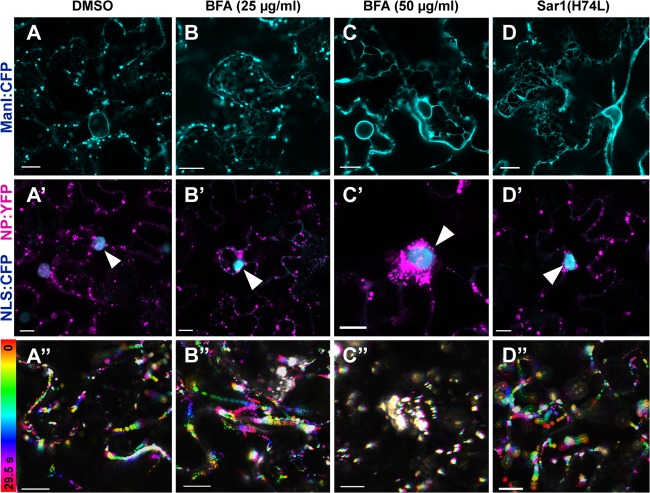
Effects of higher concentrations of BFA on NB localization and the Golgi apparatus. All images show leaves at 24 hpi. Leaves expressing ManI:CFP (A to C) or NP:YFP (pseudocolored magenta) and NLS:CFP (A′ to C′) at 18 hpi were treated with 0.5% DMSO (A and A′), BFA at 25 μg/ml (B and B′), BFA at 50 μg/ml (C and C′). Sar1(H74L) was coexpressed with ManI:CFP (D) or NP:YFP (D′). Arrowheads indicate nuclei. (A″ to D″) Integrated time-lapse images of experimental results shown in panels (A′ to D′). Bars, 10 μm.

